Use case
The customer wants to monitor temperature from a device in NMIS, the device returns temperatures as integer numbers using SNMP. The problem the customer faces is that even when the data is only integers, NMIS still display and graphs data with decimal values.
RRDTool Data Resampling
The effect that occurs here is due to data resampling, this is an important feature of RRDtool, and it is used since it is practically impossible to collect data and enter it in RRDtool at exact intervals. Therefore, RRDtool interpolates the data, so it is stored at exact intervals.
Suppose a counter increases by exactly one for every second. You want to measure it in 300 seconds intervals. You should retrieve values that are exactly 300 apart. However, due to various circumstances you are a few seconds late and the interval is 303. The delta will also be 303 in that case. Obviously, RRDtool should not put 303 in the database and make you believe that the counter increased by 303 in 300 seconds. This is where RRDtool interpolates: it alters the 303 value as if it would have been stored earlier and it will be 300 in 300 seconds. Next time you are at exactly the right time. This means that the current interval is 297 seconds and also the counter increased by 297. Again, RRDtool interpolates and stores 300 as it should be.
      in the RRD                 in reality

 time+000:   0 delta="U"   time+000:    0 delta="U"
 time+300: 300 delta=300   time+300:  300 delta=300
 time+600: 600 delta=300   time+603:  603 delta=303
 time+900: 900 delta=300   time+900:  900 delta=297
To carry out this document, real data was obtained from a server, here it is detailed how the data was obtained.
1) Polling.log
We use the "polling.log" to be able to review the exact values that NMIS is sending to the RRDTool for storage in the database (RRD).
It should be taken into consideration that this log can consume a large amount of space quickly due to the amount of data obtained during the collection or polling process. This option is not active by default, so in order to activate the log you must change the item: "polling_log" in the configuration file "Config.nmis", specifying the path where the log will be saved, it is recommended to use: '<nmis_logs> /polling.log' looking like this:
'polling_log' => '<nmis_logs>/polling.log'
NMIS will not create the polling.log file by default, even if the option is activated, the file must be created manually for NMIS to start writing over it. It is recommended to just “touch” the file:
$ touch /usr/local/nmis8/logs/polling.log
2) nmis.log
Default NMIS log, located at /usr/local/nmis8/logs/
3) RRD Dump
RRD are usually stored at /usr/local/nmis8/database/nodes/
The RRD data has to be exported using the following command:
$ rrdtool dump temperatureCPM-150995057.rrd /tmp/temperature.xml
4) Graph
We need to obtain the graph of the device on NMIS or opCharts.
Demonstration
For this demonstration, we will use the custom graph called: "temperatureCPM" that is part of the model : "Model-SAM-TiMOS.nmis".
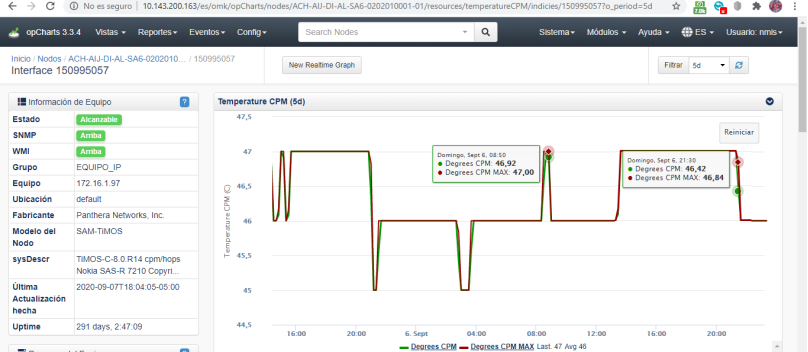
Let's focus on the value obtained on Sep. 06 2020 at 8:50am, the value displayed is 46.62. We have to consider that this graph shows a period of 5 days and data summarisation may have been already applied and the value may be slightly different, which doesn't affect the final result.

First we must export the rrd data to an XML file to be able to review its content.
Once exported, We will review the frequency of updating the RRD.

In this particular case, this RRD is updated on:
2020-09-07 18:04:11 -05
Now let’s review the last data stored in the RRD.

Here we can see that the lastest data was:
<!-- 2020-09-07 18:00:00 -05 / 1599519600 --> <row><v>4.7000000000e+01</v></row>
We can also observe that the data was stored exactly every 5 minutes.
With this we notice that the RRD was updated at 18:04:11 but the latest stored data as for the period was on 18:00:00. This is because the RRD always writes the data from the previous period. With this in mind, we are going to review the period that we are interested in demonstrating.
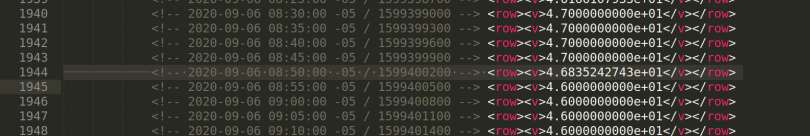
Here we can see that on 06/09/2020 08:50:00 the value: 4.6835242743e+01 was saved into the RRD.
Let’s check the polling.log to see the exact time that NMIS sent the value to the RRD and what that value was:

06-Sep-2020 08:49:10  ...   temperatureCPM,N:47
06-Sep-2020 08:54:10  ...   temperatureCPM,N:46
With this we can say that NMIS sends the data to the RRD at 08:49:10 and the RRD processes the data and writes the data corresponding to the previous period.
NMIS sent data to RRD | Received Value | Period written | Value Written |
08:44:10 | 47 | 08:40:00 | 4.7000000000e+01 |
08:49:10 | 47 | 08:45:00 | 4.7000000000e+01 |
08:54:10 | 46 | 08:50:00 | 4.6835242743e+01 |
08:59:08 | 46 | 08:55:00 | 4.6000000000e+01 |
We can see that the received value was 46 but 46,835 was written to RRD, this is where the "data resampling" was applied, actually it is been applied to all the values received by the RRD but it is only noticed when the value change occurs, when the value is constant, this effect is not appreciated.
Let's see how resampling is calculated by the RRD tool.
First we must obtain the delta or difference between the value to be examined and its previous value.
NMIS sent data to RRD | Received Value | Period written | Value Written |
08:49:10 | 47 | 08:45:00 | 4.7000000000e+01 |
08:54:10 | 46 | 08:50:00 | 4.6835242743e+01 |
The difference between 46 and 47 is 1. We have to divide this value by the interval in seconds of every period. Here the period was 5 minutes or 300 second:
1/300 = 0.00333333333 (rate)
Now we obtain the difference between the time in which the RRD received the data and the period in which it writes that data.
Received: 08:54:10 and Period Written: 08:50:00. The difference between them is 250 seconds.
Now we have to multiply the previously obtained seconds (delta) (250) by the rate (0.00333333333333), the result of this operation is: 0.83333333 (resampling value)
In this case, the value is descending from 47 to 46, for these reason the result must be added to the current received value (46), the final result is: 46.83333333
This result is slightly different to the one displayed: , as we are not considering the millisecond when the data was stored on the RRD.
On the other hand, if the value increments, the same operation must be done, however the resampling value has to be taken from the current received value.
For example:
NMIS sent data to RRD | Received Value | Period written | Value Written |
08:24:10 | 46 | 08:20:00 | 4.600000000e+01 |
08:29:10 | 47 | 08:25:00 | 4.6166107933e+01 |
The delta is 1 (47 and 46), interval in seconds between data: 300 Seconds.
1/300 = 0.00333333333 (rate)
The difference between the data received and the period written: again, 250 seconds.
The resampling value is: 0.83333333333
The current received value is: 47, because the value is increasing from 46 to 47, we have to take the reampling value (0.83333333333) from current received value.
47-0.83333333333 = 46.1666666667
