1. Overview
NMIS8 includes powerful capabilities for performance and operational thresholding, which greatly enhance network management capabilities. These thresholds result in alerts/events/notifications which NMIS can send when it sees a threshold breached. The thresholds have very granular controls which by default have been configured fairly broadly.
In this tutorial, we will walk you through creating a new threshold for the "System Load Avg" of a currently installed device on NMIS8.
What you’ll learn
How to use the common threshold configuration.
How to create a new threshold for a device.
The association and dependencies between configuration files.
What you’ll need
Our Opmantek Virtual Appliance (VM) from Opmantek.com
Background Information
The Linux system load is a measurement of the computational work the system is performing. A completely idle computer has a load average of 0. Each running process either using or waiting for CPU resources adds 1 to the load average. So, if your system has a load of 5, five processes are either using or waiting for the CPU.
On its own, the load number doesn’t mean too much. A computer might have a load of 0 one split-second, and a load of 5 the next split-second as several processes use the CPU. Even if you could see the load at any given time, that number would be basically meaningless.
That’s why Unix-like systems don’t display the current load. They display the load average. This allows you to see how much work your computer has been performing.
It is important to clarify that on Linux at least, the load average and CPU utilisation are actually two different things. Load average is a measurement of how many tasks are waiting for the CPU (not just CPU time but also disk activity) over a period of time. CPU utilisation is a measure of how busy the CPU is right now. The most load that a single CPU thread pegged at 100% for one minute can "contribute" to the 1 minute load average is 1. A 4 core CPU with hyper-threading (8 virtual cores) all at 100% for 1 minute would contribute 8 to the 1 minute load average.
If you are not familiar with these concepts, here you can find detailed information about Understanding Linux CPU Load and Linux Load Averages.
2. Set up your environment
If you haven’t done it yet. Download our latest Virtual Appliance from Opmantek.com
Import it into your favourite hypervisor, run the VM and get the IP address assigned to it.
For this tutorial, my NMIS8 environment is using 192.168.1.100, this IP address may be different on your set up.
NMIS adds the server where it is hosted as “localhost” and the model used is “Net-snmp”, the model and the related files are usually stored in: /usr/local/nmis8/models/
You need to access the VM via SSH to edit the configuration files, the default credentials for the VM are:
username: root
password: NM1$88
3. Creating a new threshold
As mentioned before, we will be creating a threshold for the Linux “System Load Averages”, we want to generate events when current values exceed the threshold.
First, we need to open the Model, in this case /usr/local/nmis8/model/Model-net-snmp.nmis and identify the item that we need to modify.
The item to modify is “laload” (Linux Average Load) that is under the “system → rrd” section.

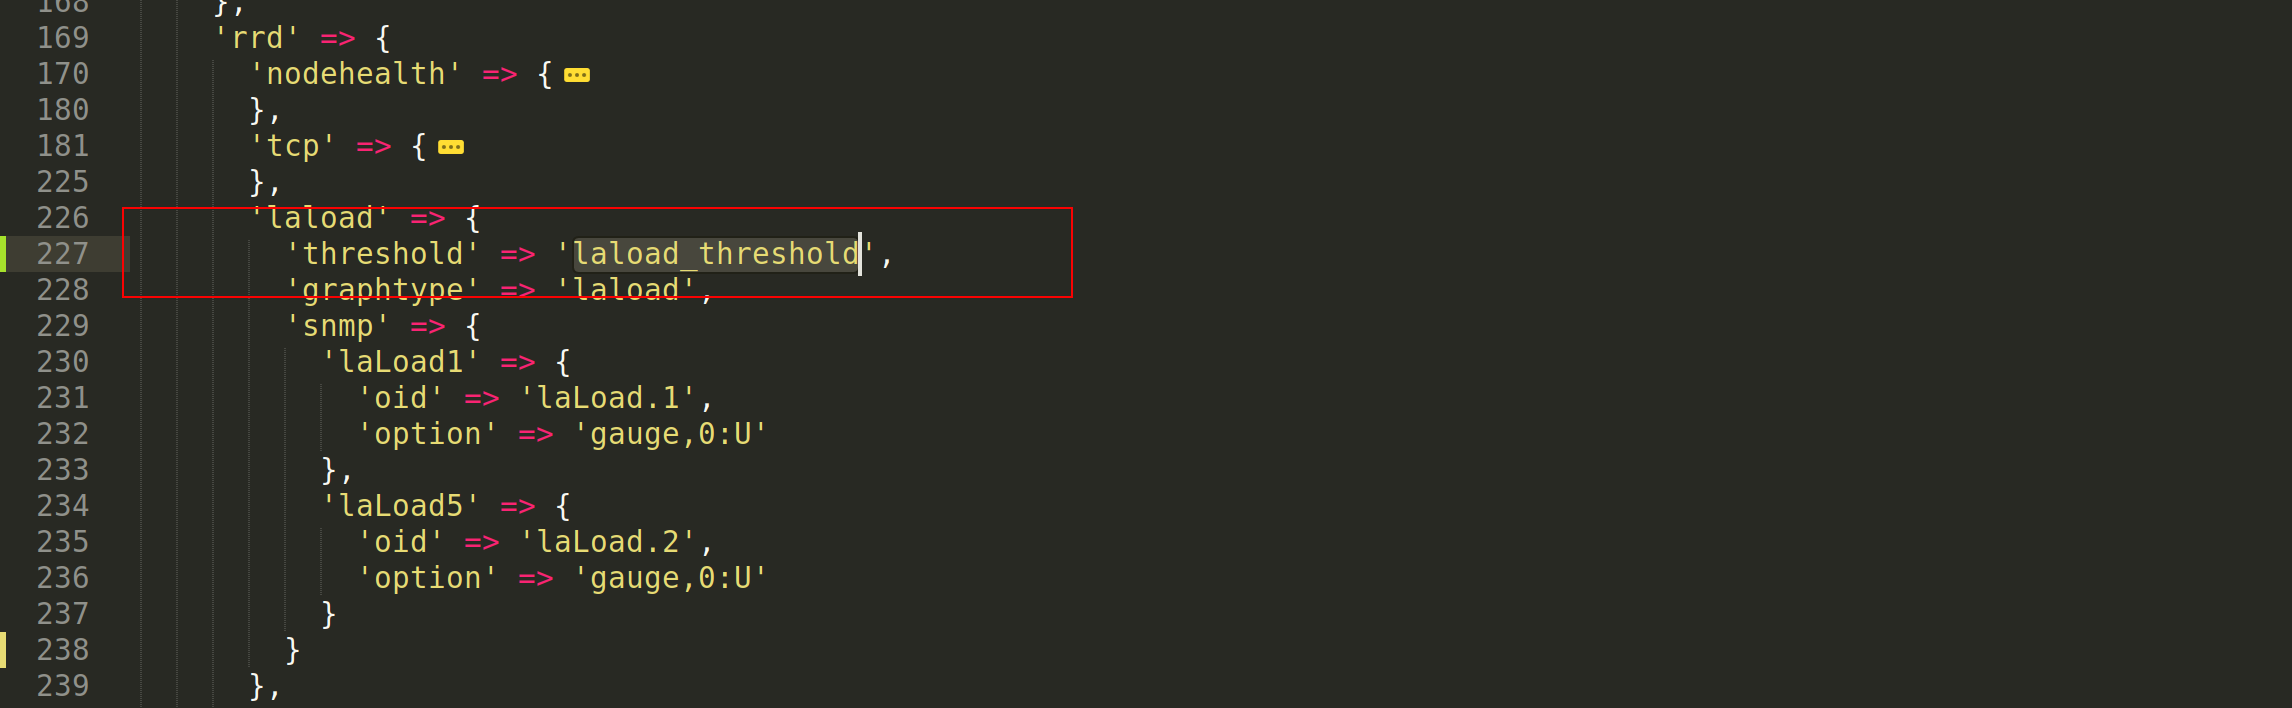
On the “laload” item we have to add the “threshold” item as follow:
'threshold' => 'laload_threshold',
In this particular case, we have named the threshold “ laload_threshold” to make it more noticeable and to be more clear, however this is not a rule.
--snip--
      'laload' => {
        'threshold' => 'laload_threshold',
        'graphtype' => 'laload',
        'snmp' => {
          'laLoad1' => {
            'oid' => 'laLoad.1',
            'option' => 'gauge,0:U'
          },
          'laLoad5' => {
            'oid' => 'laLoad.2',
            'option' => 'gauge,0:U'
          }
        }
      },
--snip--
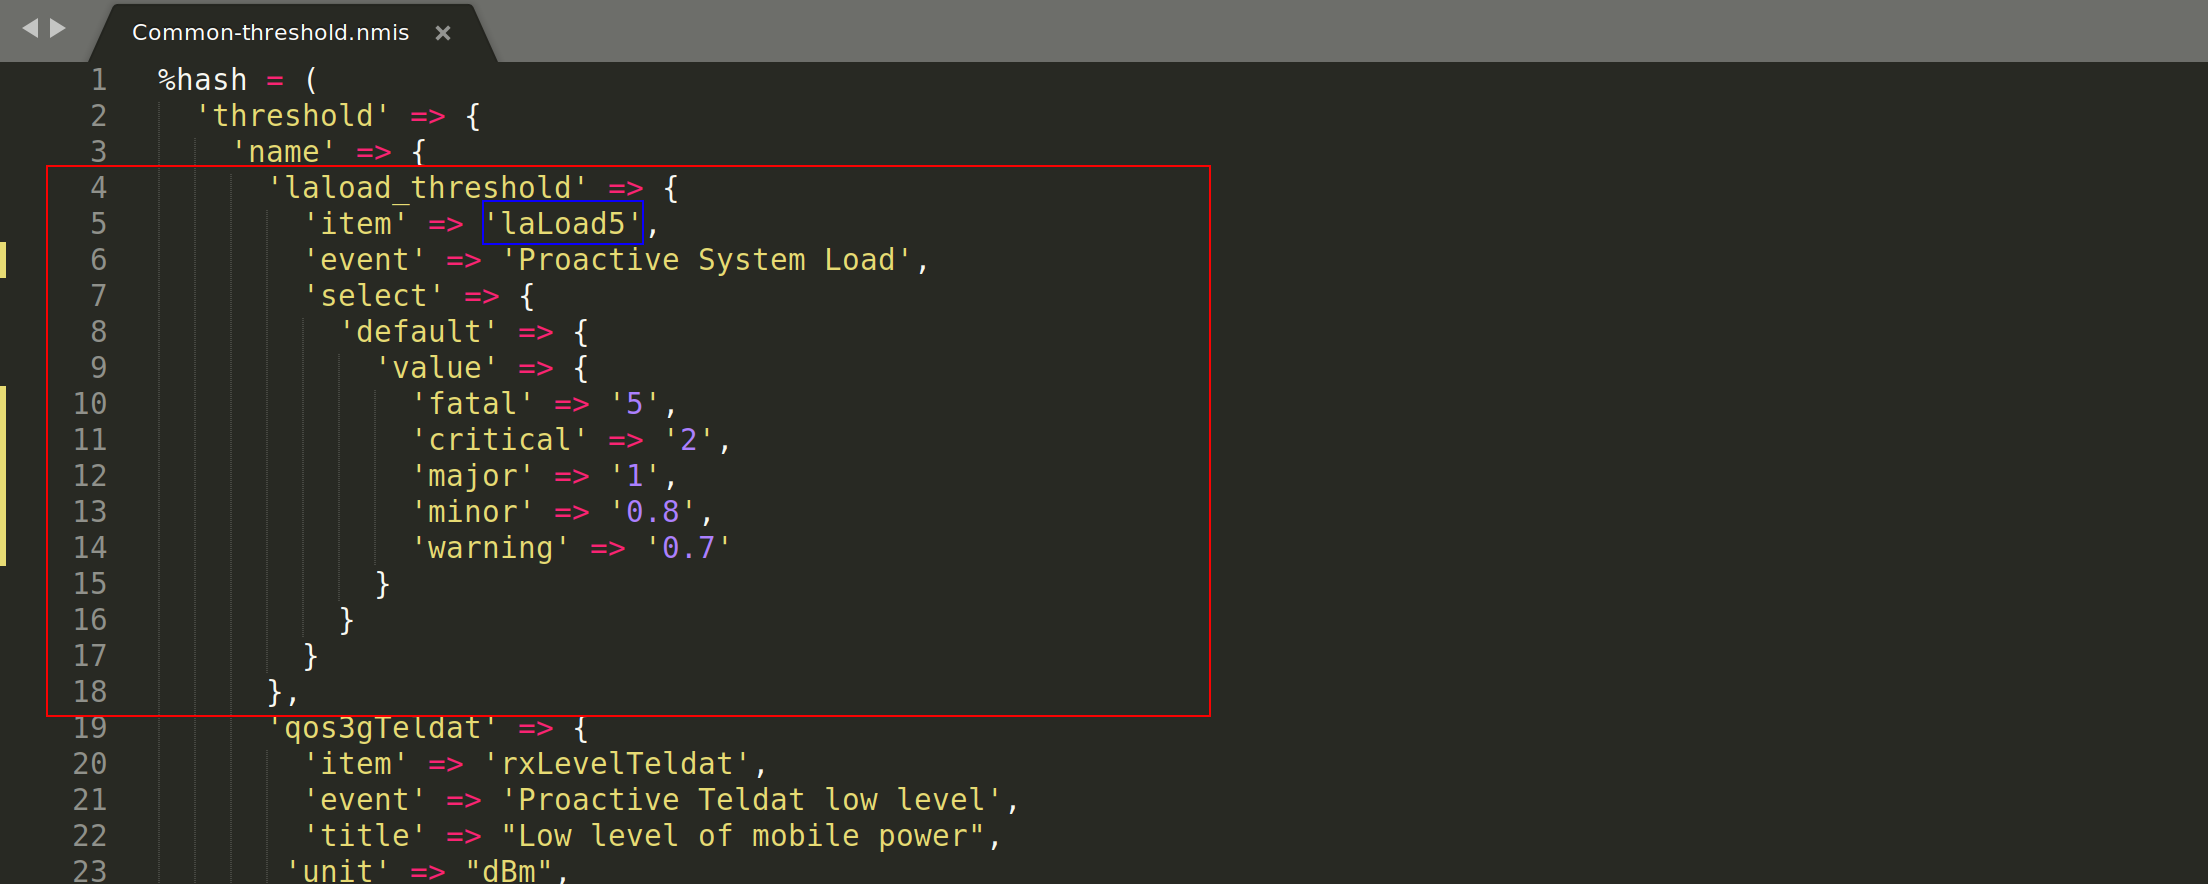
We add the threshold values to /usr/local/nmis8/models/Common-threshold.nmis, using the name specified before. The event name must include "Proactive" at the beginning.
%hash = (
  'threshold' => {
    'name' => {
      'laload_threshold' => {
        'item' => 'laLoad5',
        'event' => 'Proactive System Load',
        'select' => {
          'default' => {
            'value' => {
              'fatal' => '5',
              'critical' => '2',
              'major' => '1',
              'minor' => '0.8',
              'warning' => '0.7'
            }
          }
        }
      },
--snip--
Next we add statistics extraction to /usr/local/nmis8/models/Common-stats.nmis
Adding it inside the “type” section.
- In green, we have to use the name used in the /usr/local/nmis8/models/Common-database.nmis, because the stats need to know which database to read.
- In blue, the name of the 'item' holding the variable, see 'item' in blue box in the Common-stats.nmis pictre above.
- In magenta, the name of the data source specified in the model inside the rrd section, in this case is “laLoad5"
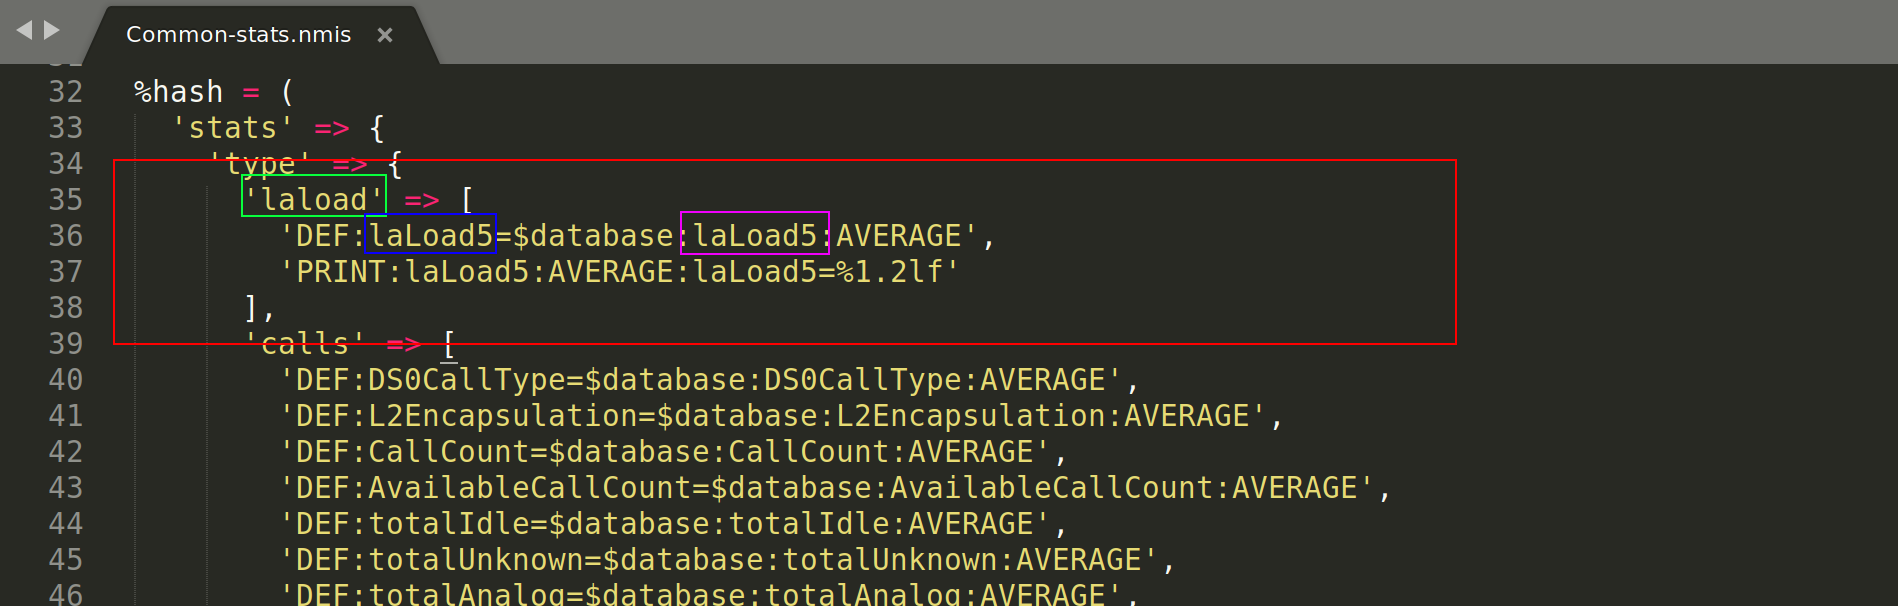
%hash = (
  'stats' => {
    'type' => {
      'laload' => [
        'DEF:laLoad5=$database:laLoad5:AVERAGE',
        'PRINT:laLoad5:AVERAGE:laLoad5=%1.2lf'
      ],
--snip--
We use the name of the database specified on /usr/local/nmis8/models/Common-database.nmis (in green)

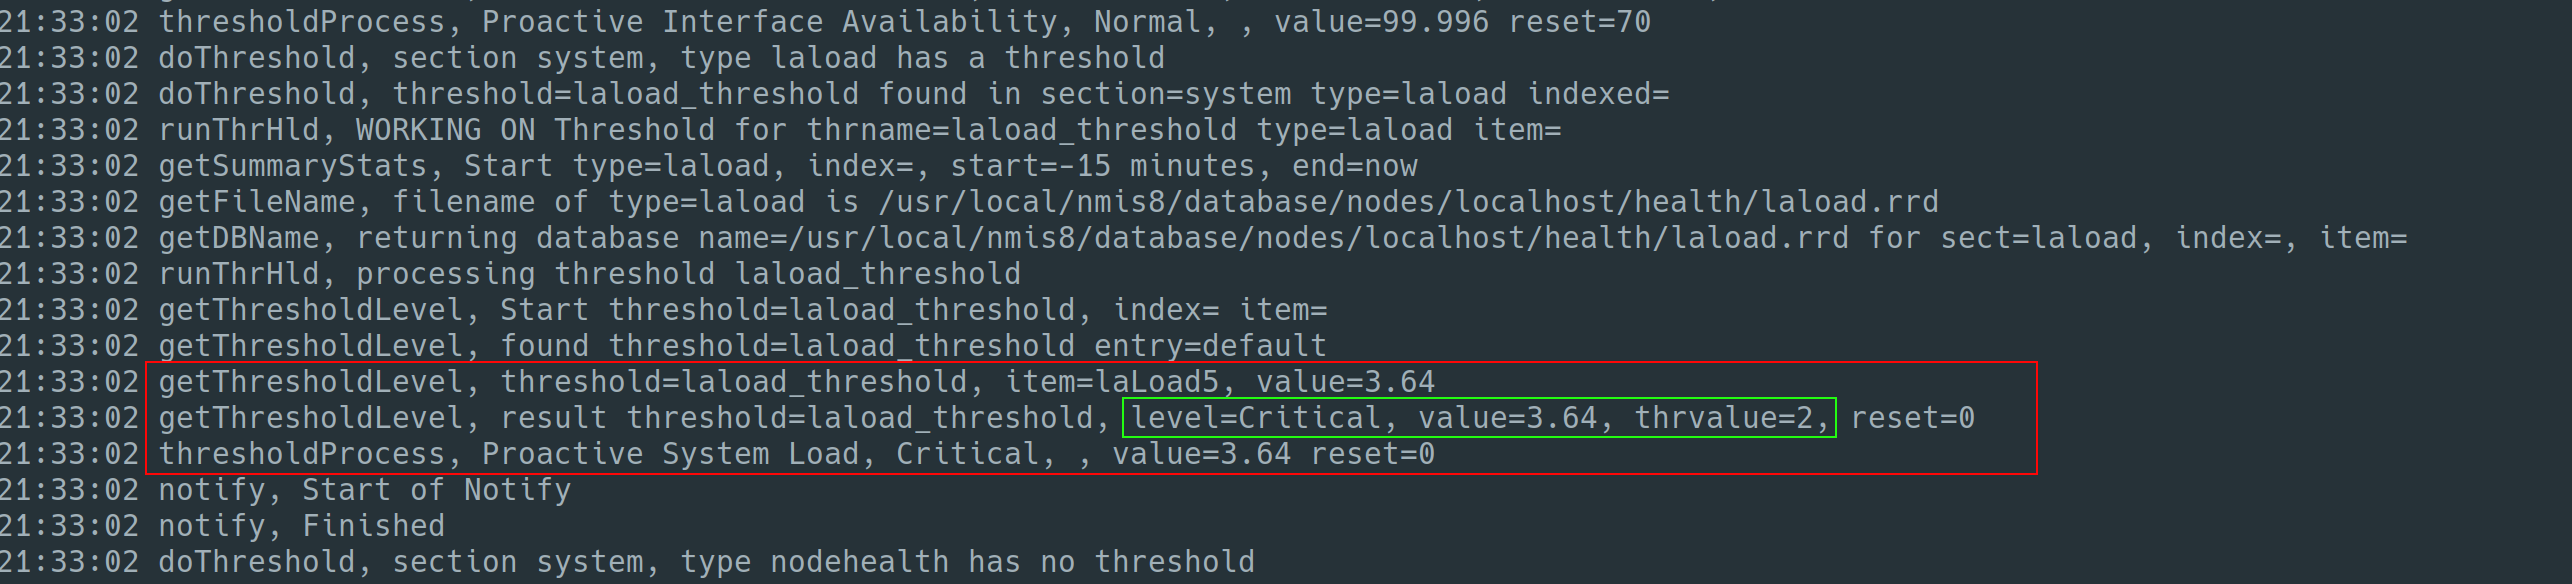
Once we have created the threshold, it is time to tested. The best way to test if it is working as desired, is by running: /usr/local/nmis8/bin/nmis.pl and using debug=1
$ /usr/local/nmis8/bin/nmis.pl type=threshold debug=1 node=localhost
As we can see, the output show, that the threshold has been applied, in this case we see that the current value is 3.64 which has a current level of Critical because it has exceeded the threshold value of 2. (in green).
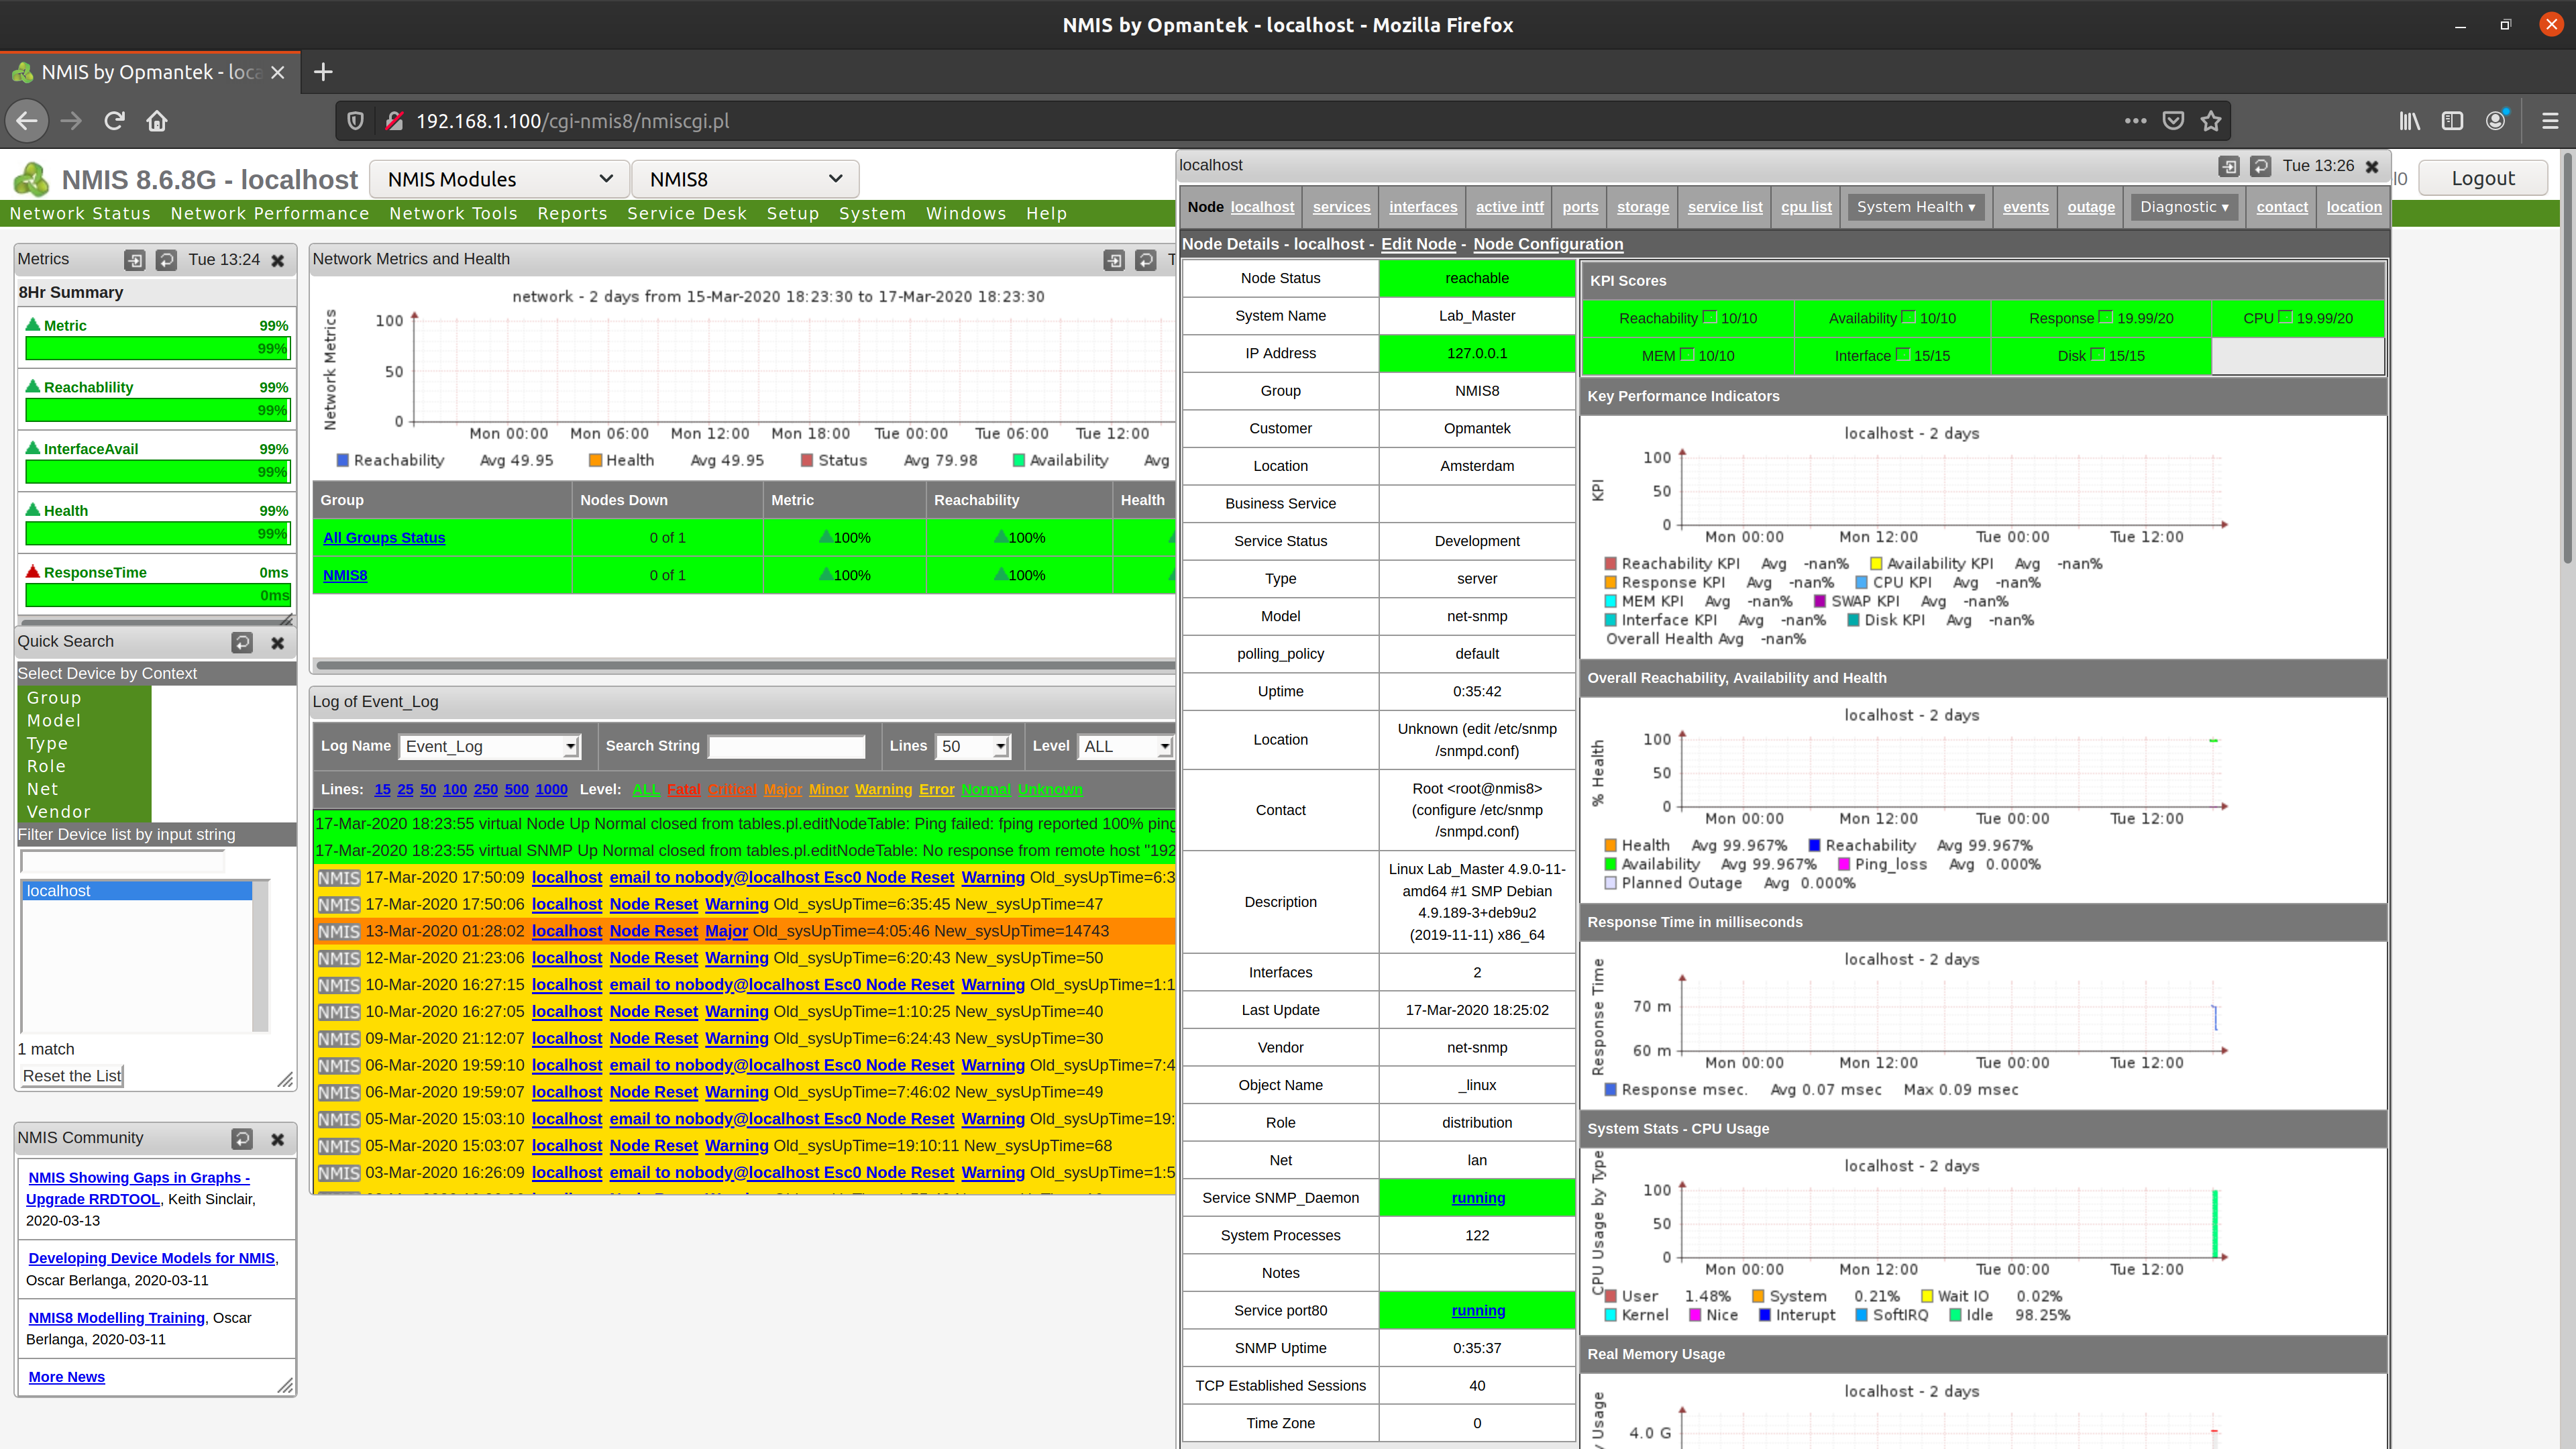
And finally, go to NMIS GUI and check the event for the node "localhost", we can see that the alert has been created and is showing the details as expected.

Now, we have set up properly our threshold for "Linux System Load"