3 answers
- 10-1
Hello Andrew,
What version of NMIS are you running? Updates are scheduled via a cron job in /etc/cron.d/nmis and are usually done once daily around 1am server time.
You can see what's happening by selecting Reports-> Current -> Collect/Update Time from the NMIS menu. Then, sort on the Update column. Which devices are taking long times to respond (or not responding at all) to the update? Can the device be reached from the NMIS server? Do you the the right credentials?
- Andrew Webster
I have now decided to create a new server as none of these options have worked and I will migrate nodes to the new server.
Add your comment... - 10-1
Andrew
Go to
[root@lodur:~]# vi /etc/cron.d/nmis
Verify this line is active
######################################################
# Run (selective) Statistics and Service Status Collection often
*/5 * * * * root /usr/local/nmis8/bin/nmis.pl type=collect mthread=true
######################################################
# Run the update once a day
30 20 * * * root nice /usr/local/nmis8/bin/nmis.pl type=update mthread=true
Regards
- Andrew Webster
Hi checked that and the two options you have shown were there and also a couple of others, none of this has changed recently. The only thing I can see is your run (selective) has a */5 as the next line and mines doesn't. ###################################################### # Run (selective) Statistics and Service Status Collection often * * * * * root /usr/local/nmis8/bin/nmis.pl type=collect mthread=true ; /usr/local/nmis8/bin/nmis.pl type=services mthread=true ###################################################### # Run Summary Update every 5 minutes */5 * * * * root /usr/local/nmis8/bin/nmis.pl type=summary ###################################################### # Run the update once a day 30 20 * * * root nice /usr/local/nmis8/bin/nmis.pl type=update mthread=true ###################################################### # Run the thresholding four times an hour # only necessary if threshold_poll_cycle is set to false #*/15 * * * * root nice /usr/local/nmis8/bin/nmis.pl type=threshold # backup configuration, models and crontabs once a day, and keep 30 backups 22 8 * * * root /usr/local/nmis8/admin/config_backup.pl /usr/local/nmis8/backups 30 ###################################################### # purge old files every few days 2 2 */3 * * root /usr/local/nmis8/bin/nmis.pl type=purge ###################################################### # Save the Reports, Daily Monthly Weekly 9 0 * * * root /usr/local/nmis8/bin/run-reports.pl day all 9 1 * * 0 root /usr/local/nmis8/bin/run-reports.pl week all 9 2 1 * * root /usr/local/nmis8/bin/run-reports.pl month all
- Andrew Webster
I have just checked and this is exactly the same as our test system which doesn't have this issue.
- Mark Henry
Check your cron daemon - service crond status If stopped restart. Also suggest you check your logs in /usr/local/nmis8/logs and see if there is anything there stopping NMIS from running.
- Andrew Webster
Mark, Thanks for the information, it will be next week now before I am back in the office to check but I will mark your answer if that proves to be the issue. Many thanks for your time
- Andrew Webster
I have checked the Cron job and that was working OK, I still restarted it just to make sure also I have checked the log and can't find any entries for the Cron job or the server itself in the NMIS.log
- Andrew Webster
This also work fine for the test system which is cloned from this system but with much fewer nodes.
- Andrew Webster
I have also started the "system>Host Diagnostic>NMIS Runtime graph" and this shows Total runtime 24.16 Seconds, Collect time 19.52, NMIS processes 2.0 and max parallel processes 12.8 and the graph stays the same no variance. I have now rebooted the system and run an update neither seems to have help the system.
- José Iván Anguiano Reyes
Andrew. Please attach a graph of a single node, it is showing the complete information updated? It is showing just till 12/14/18?
Add your comment... - 10-1
Our version is 8.6.4G
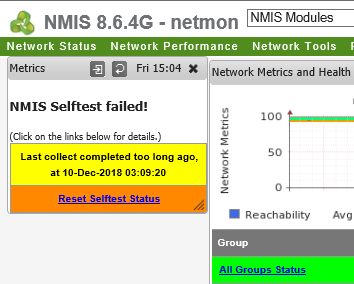
If you select Network status>Metrics the small window that opens is the one I am referring to, as per the image attached.
- Mark Henry
Andrew, Please see my comment below. The nmis cron job controls performance collection as well as updates. Perhaps the cron daemon has stopped? Do you have adequate drive space for the data? Check using the command df -h
- Andrew Webster
Mark, Sorry misunderstood, I have run the command and the out put is below and the space looks OK. The report you mentioned shows green across everything, is there a way to stop and then restart the cron scheduler. Size Used Avail Use% Mounted on /dev/mapper/vg_nmis64-lv_root 16G 2.4G 13G 16% /tmpfs 1.9G 0 1.9G 0% /dev/shm/dev/sda1 477M 178M 274M 40% /boot/dev/mapper/vg_nmis64_data-lv_data 40G 9.0G 29G 25% /data/dev/mapper/vg_nmis64-lv_var 20G 2.3G 16G 13% /var
- Mark Henry
Andrew, What happens if you click the blue Reset Selftest Status link in the Metrics window?
Add your comment...

I have the metrics window opened as part of my main dashboard and it has started showing "NMIS selftest failed - last update too long ago" it then has a date 10/12/2018 and it is now 14/12/18. our test system which was cloned from the production server but has most of the nodes removed doesn't have this issue.