opCharts HTML widgets is a way to define templates which opCharts can render and present to the user.
Prerequisites
- opCharts version >= 4.0.9
- You will need system administration privileges so you can create the required files in the /usr/local/omk directory.
How to
- Create a new template file and have its prefix .html.ep in <omk_dir>/templates/public/.
- Define any arbitrary HTML inside the template as you see fit, mojolicious templates are also supported, see more on rendering mojolicious templates at https://mojolicious.org/perldoc/Mojo/Template
Create an opCharts component to tell the dashboard it can render this new file. For this, create a new json file in /usr/local/omk/lib/json/opCharts/components.d/: Example: acme_component.json
{ "name": "What the component is called in the dashboards dropdown list", "ep_template_file": "The loccation of the template file", "options": { "titleText": "the component display name" }, "type": "ep_template" }- Restart the omkd daemon. Please note that omkd daemon should be restarted after any change.
Examples
Simple Component
- Create <omk_dir>/templates/public/acme_list.html.ep
Add the html content:
<h1>
Hello, World!
</h1>
Create <omk_dir>/lib/json/opCharts/components.d/acme_component.json
acme_component.json{ "name": "Acme Component", "ep_template_file": "public/acme_list", "options": { "titleText": "My Title" }, "type": "ep_template" }Restart omkd daemon:
sudo service omkd restart
Wikipedia Search
In this example we will create a Dashboard with a Wikipedia Search.
- Create <omk_dir>/templates/public/wikipedia.html.ep
- Add the html content:
<div class="row">
		<div class="container-fluid">
			<div class="navbar-header">
                <iframe id="wikipediaIframeExample"
                    title="Wikipedia iframe Example"
                    width="900"
                    height="600"
                    src="https://www.wikipedia.org/">
                </iframe>
            </div>
        </div>
 </div>
Create <omk_dir>/lib/json/opCharts/components.d/wikipedia_component.json
wikipedia_component.json{ "name": "Wikipedia Component", "ep_template_file": "public/wikipedia", "options": { "titleText": "Wikipedia search Embebed" }, "type": "ep_template" }Restart omkd daemon:
consolesudo service omkd restart
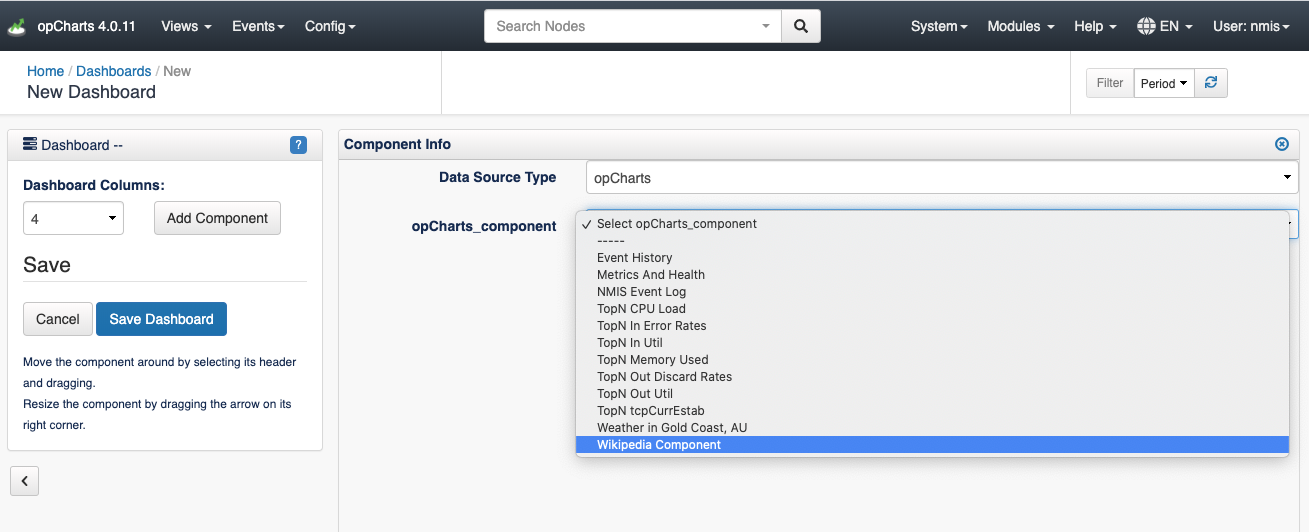
- Go to our Server Views/Dashboards: http://ourserver/en/omk/opCharts/dashboards and Add a New Dashboard.
- Select Data Source Type> opCharts. We will out new component, Wikipedia Component.
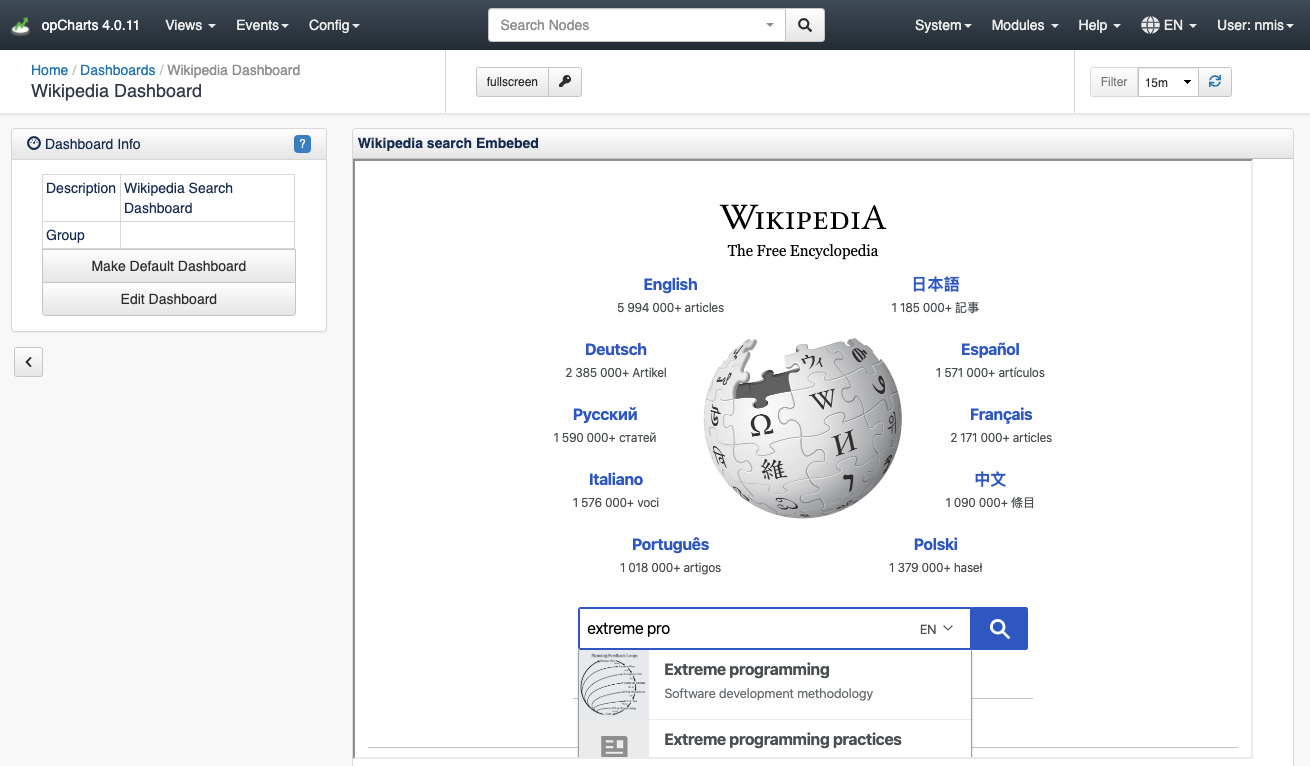
- We will see our new Dashboard:
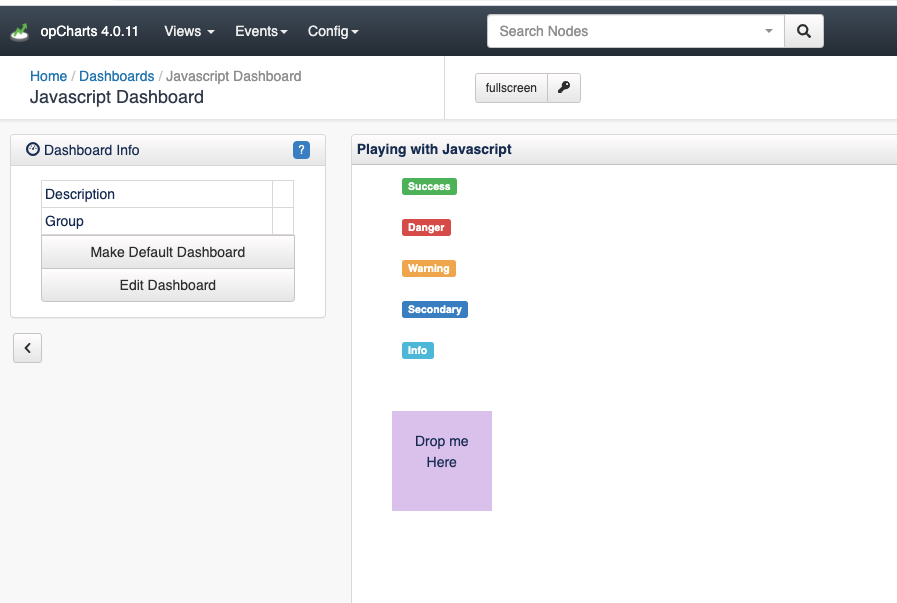
Using Javascript
In this example we will create a Dashboard with a Drag and Drop Javascript functionality as an example of how Javascript can be used.
- Create <omk_dir>/templates/public/jsexample.html.ep
- Add the html content:jsexample.html.ep
%# JS
%= javascript begin
var templateHtml;
$(document).ready(function(){

	$("#sortable li").addClass("drop").bind('mousedown',function(){
		templateHtml = $("#sortable").html();
	});
	$("#sortable").sortable();
	$("#droppable").droppable({
		activeClass: 'active',
		hoverClass:'hovered',
		accept:".drop",
		drop:function(event,ui){
			$("#sortable").sortable('destroy').html(templateHtml);
			$("#sortable").sortable();
			$("#sortable li").addClass("drop").bind('mousedown',function(){
				templateHtml = $("#sortable").html();
			});
			alert(ui.draggable.text());
		}
	});

});
% end
%# CSS Style
<style type="text/css">
	#sortable li{
		clear:both;
		float:left;
        margin: 10px;
	}

	#droppable {
		clear:both;
		height:100px;
		width:100px;
		background-color:#DEC9F0;
        margin: 40px;
        padding: 20px;
	}
	#droppable.active {
		background-color:#CFC;
	}
	#droppable.hovered {
		background-color:#CCF;
	}
</style>

<ul id="sortable">
<li id="one"><span class="label label-success">Success</span></li>
<li id="two"><span class="label label-danger">Danger</span></li>
<li id="three"><span class="label label-warning">Warning</span></li>
<li id="four"><span class="label label-primary">Secondary</span></li>
<li id="five"><span class="label label-info">Info</span></li>
<li id="six"><span class="label label-light">Light</span></li>
</ul>

<div id="droppable">
<center>Drop me Here</center>
</div>
Create <omk_dir>/lib/json/opCharts/components.d/jsexample_component.json
jsexample_component.json{ "name": "Javascript Example Component", "ep_template_file": "public/jsexample", "options": { "titleText": "Javascript Example" }, "type": "ep_template" }Restart omkd daemon:
consolesudo service omkd restart
- Go to our Server Views/Dashboards: http://ourserver/en/omk/opCharts/dashboards and Add a New Dashboard.
- Select Data Source Type> opCharts. We will select our new component, Javascript Example.
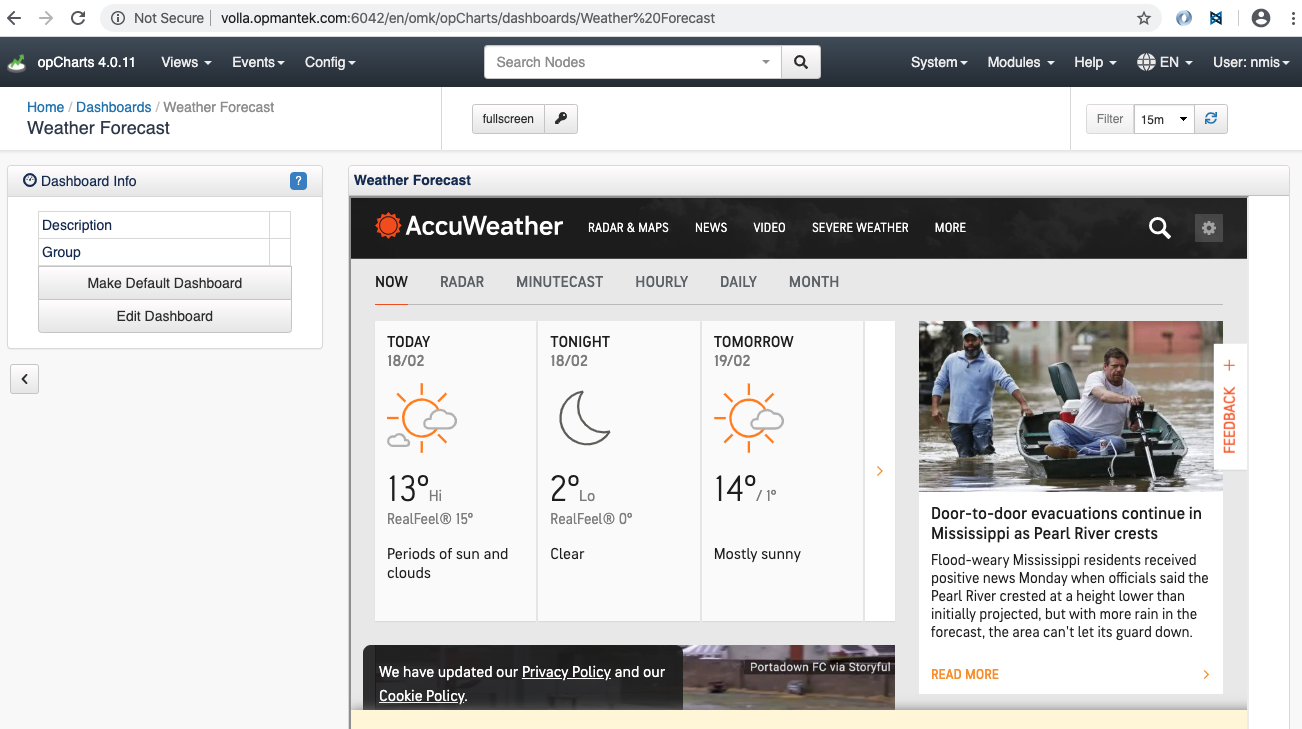
- We will see our new Dashboard:
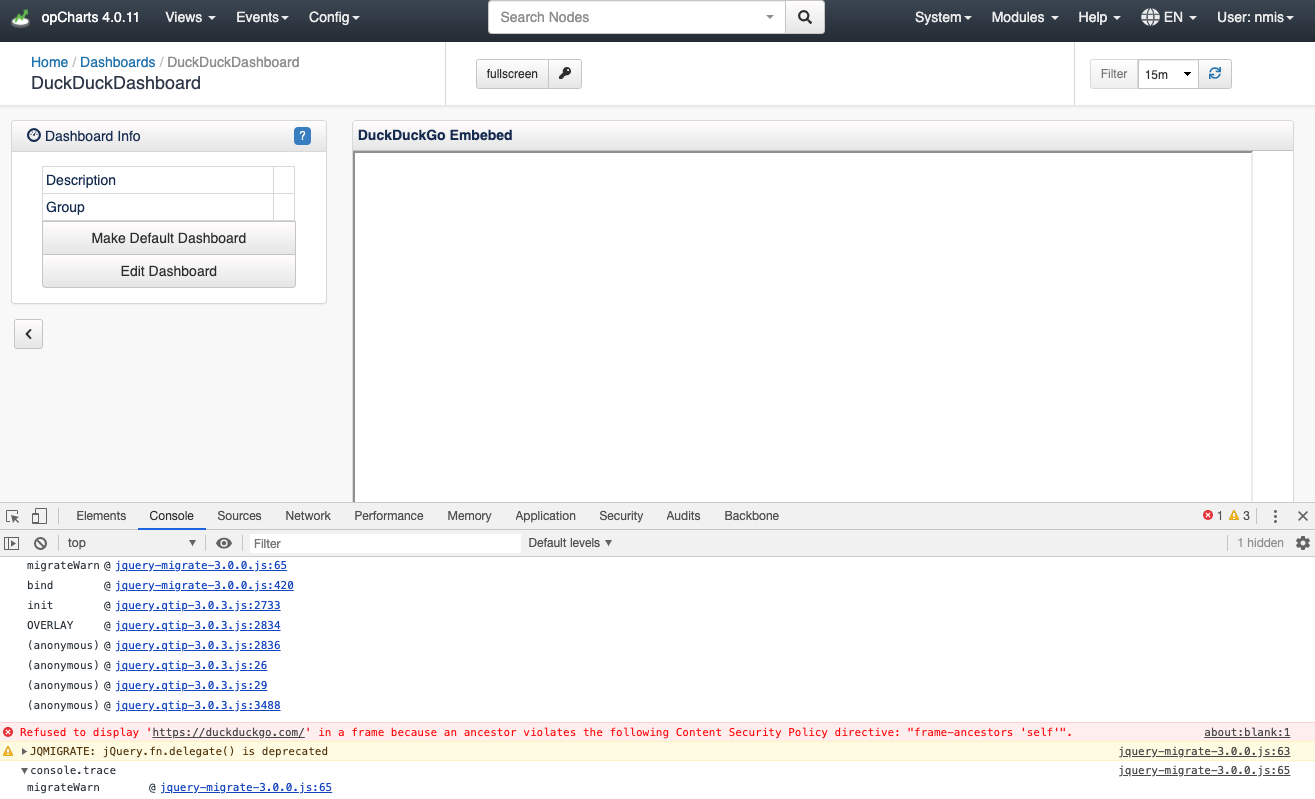
External Server restrictions
It is not possible to embedded some webpages in an iFrame due to the CSP. The Content Security Policy is a http header from the original server that prevents to load a webpage from an external domain - Or even the same.
It is possible to identify wether the page has this header visiting the external webpage and looking for the existence of the content-security-policy header:
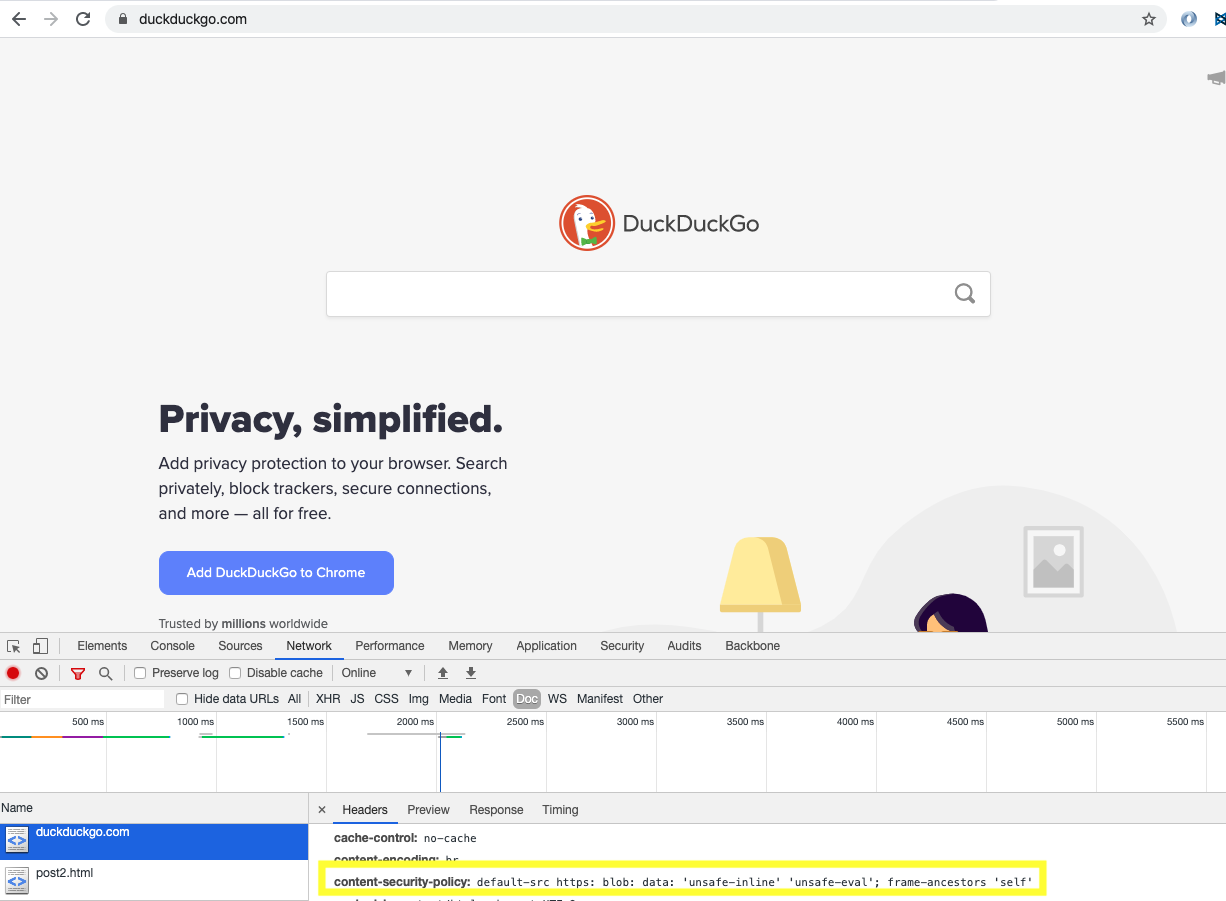
Trying to embed this webpage as an iframe, the result will be something like the following: