Real-time charts are used to monitor a device at a higher frequency than NMIS is currently monitoring it, they may also be described as "close watch" or "fast polling" charts. In the first release of real-time charts only devices currently being monitored by NMIS can be added.
Background
There are two parts to a real-time chart:
The polling definition describes what will be collected and how the data will be presented. The collection defines which node will be polled, which polling definition will be used and defines the parameters around collection and data retention.
How to view a list of real time charts (collectors) - ones which have been previously created
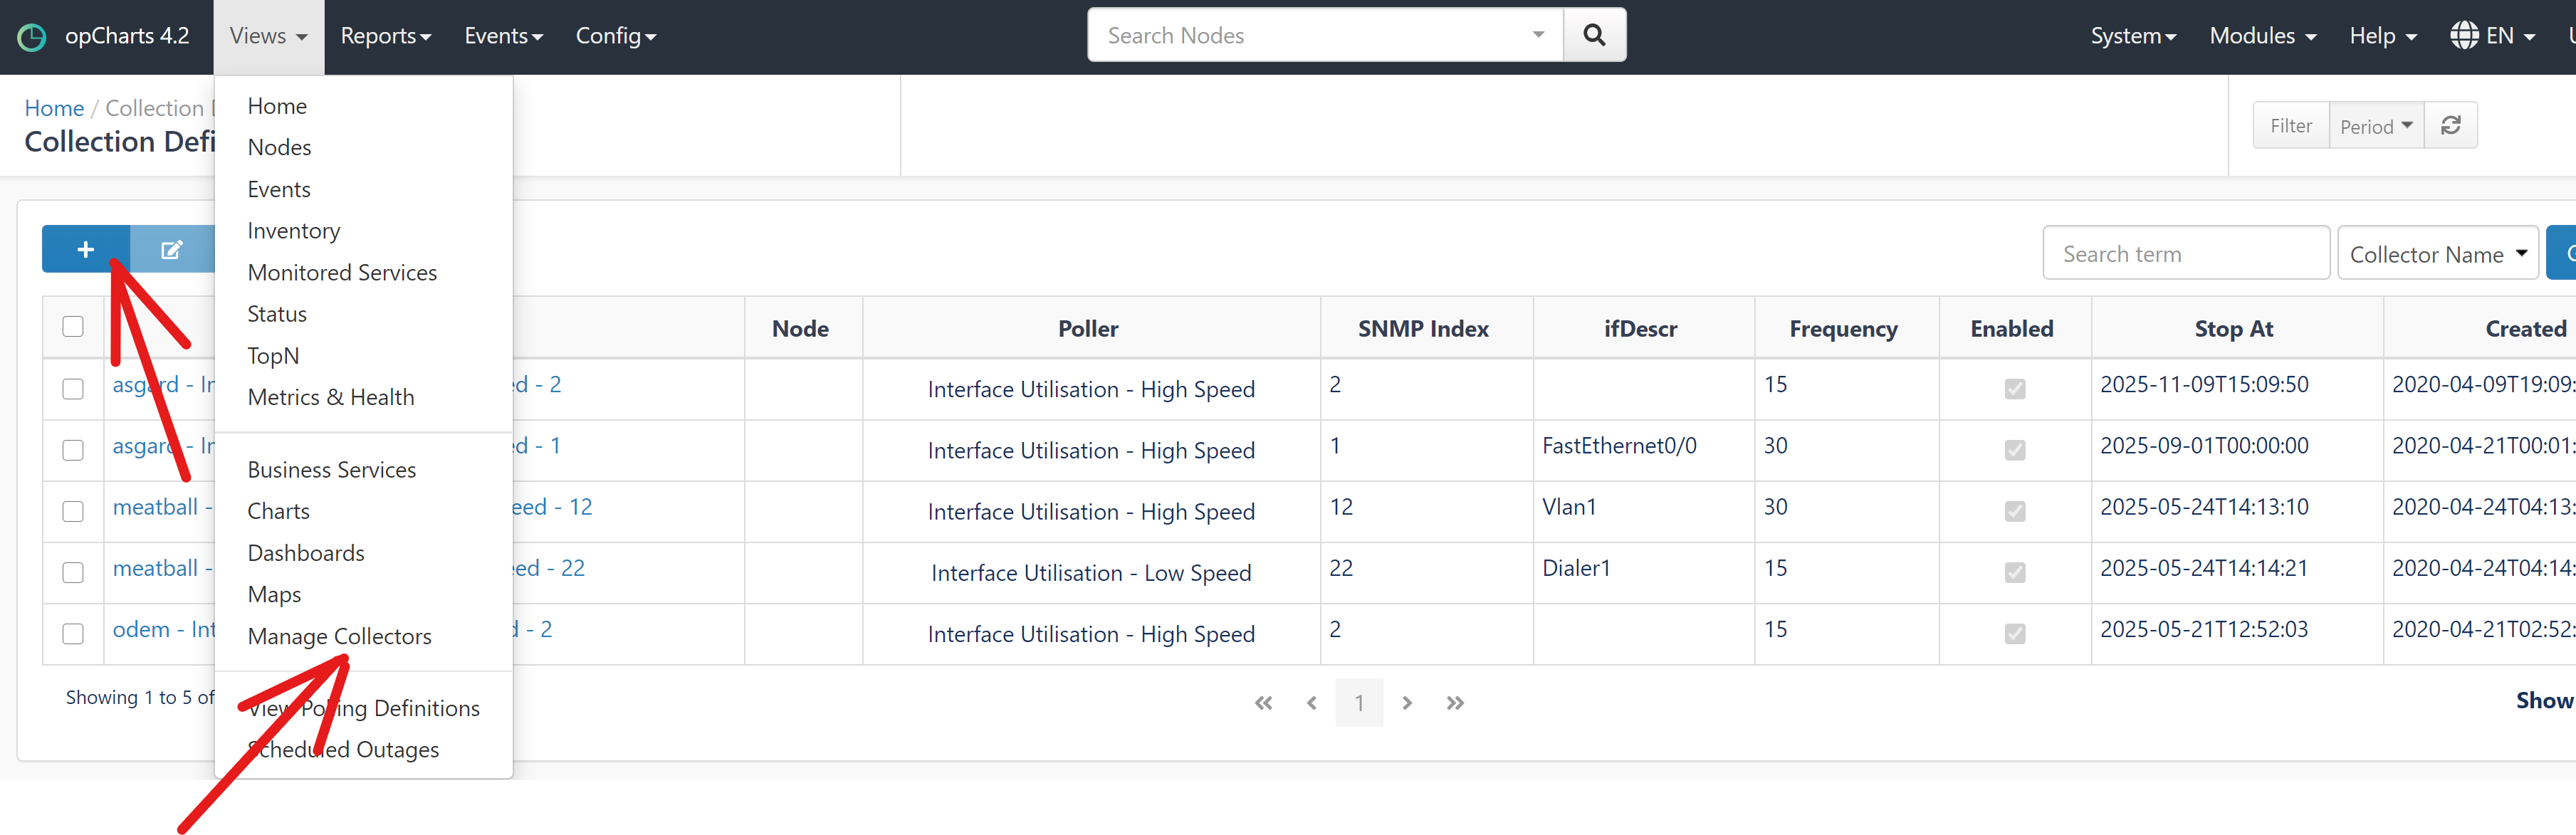
Simply browse to Views → Manage Collectors. There you will see a list of collectors - which devices, interfaces etc and how when those real time collectors will stop.
How to create new Collectors
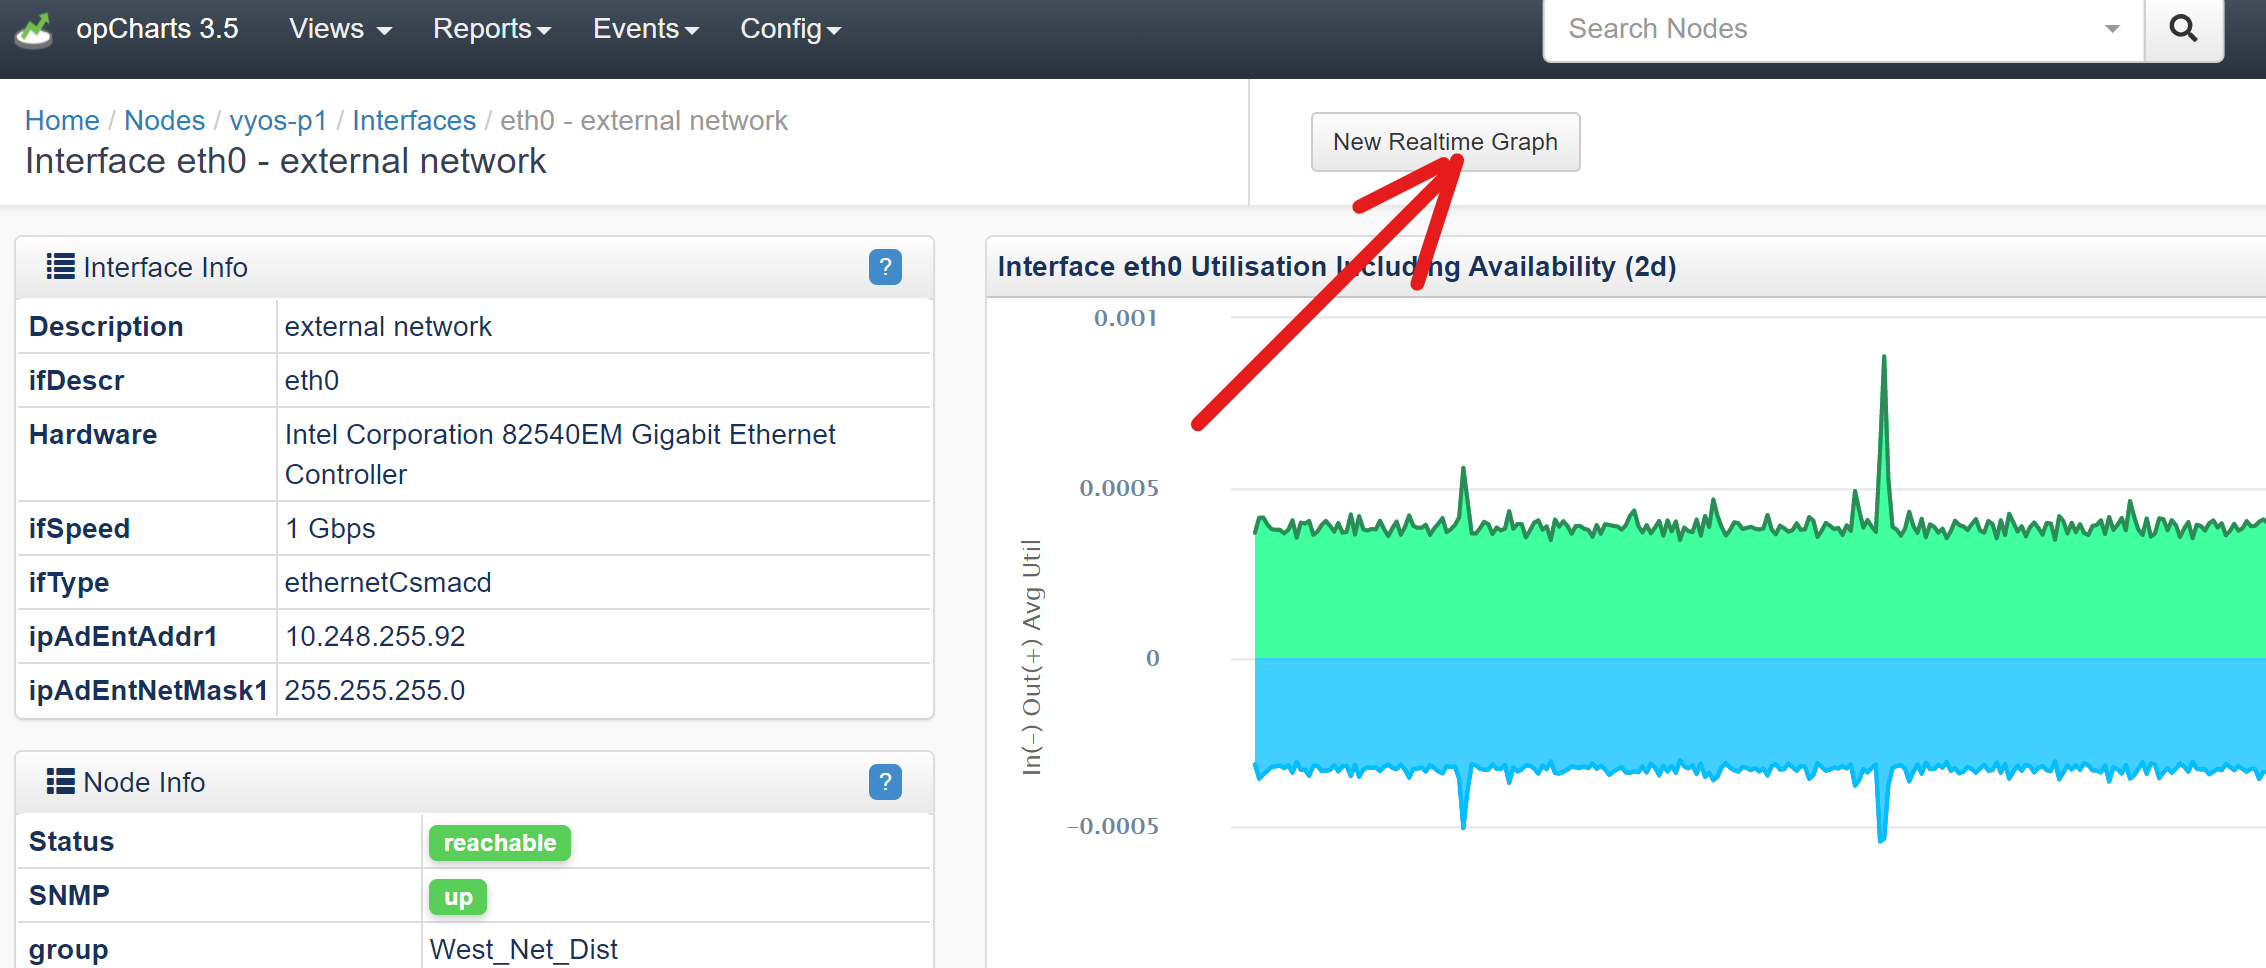
From the Node's Interface Graph view
Browse to the Node you are interested in, find the interface and simply click the New Realtime Graph button.
By defining a new Collector
Click Views-ManageCollectors then use the Plus button to define a new collector.
Choose the Device, the Polling Definition (note - you can create new ones as described a here Polling Definition (pollers) )
This will then show the available resources e.g interfaces, you should then select how long lived the Real Time collection should occur for considering that sub minute polling will collect a lot of data very fast on the disk.
