Requires opCharts-4.0.9 and Above.
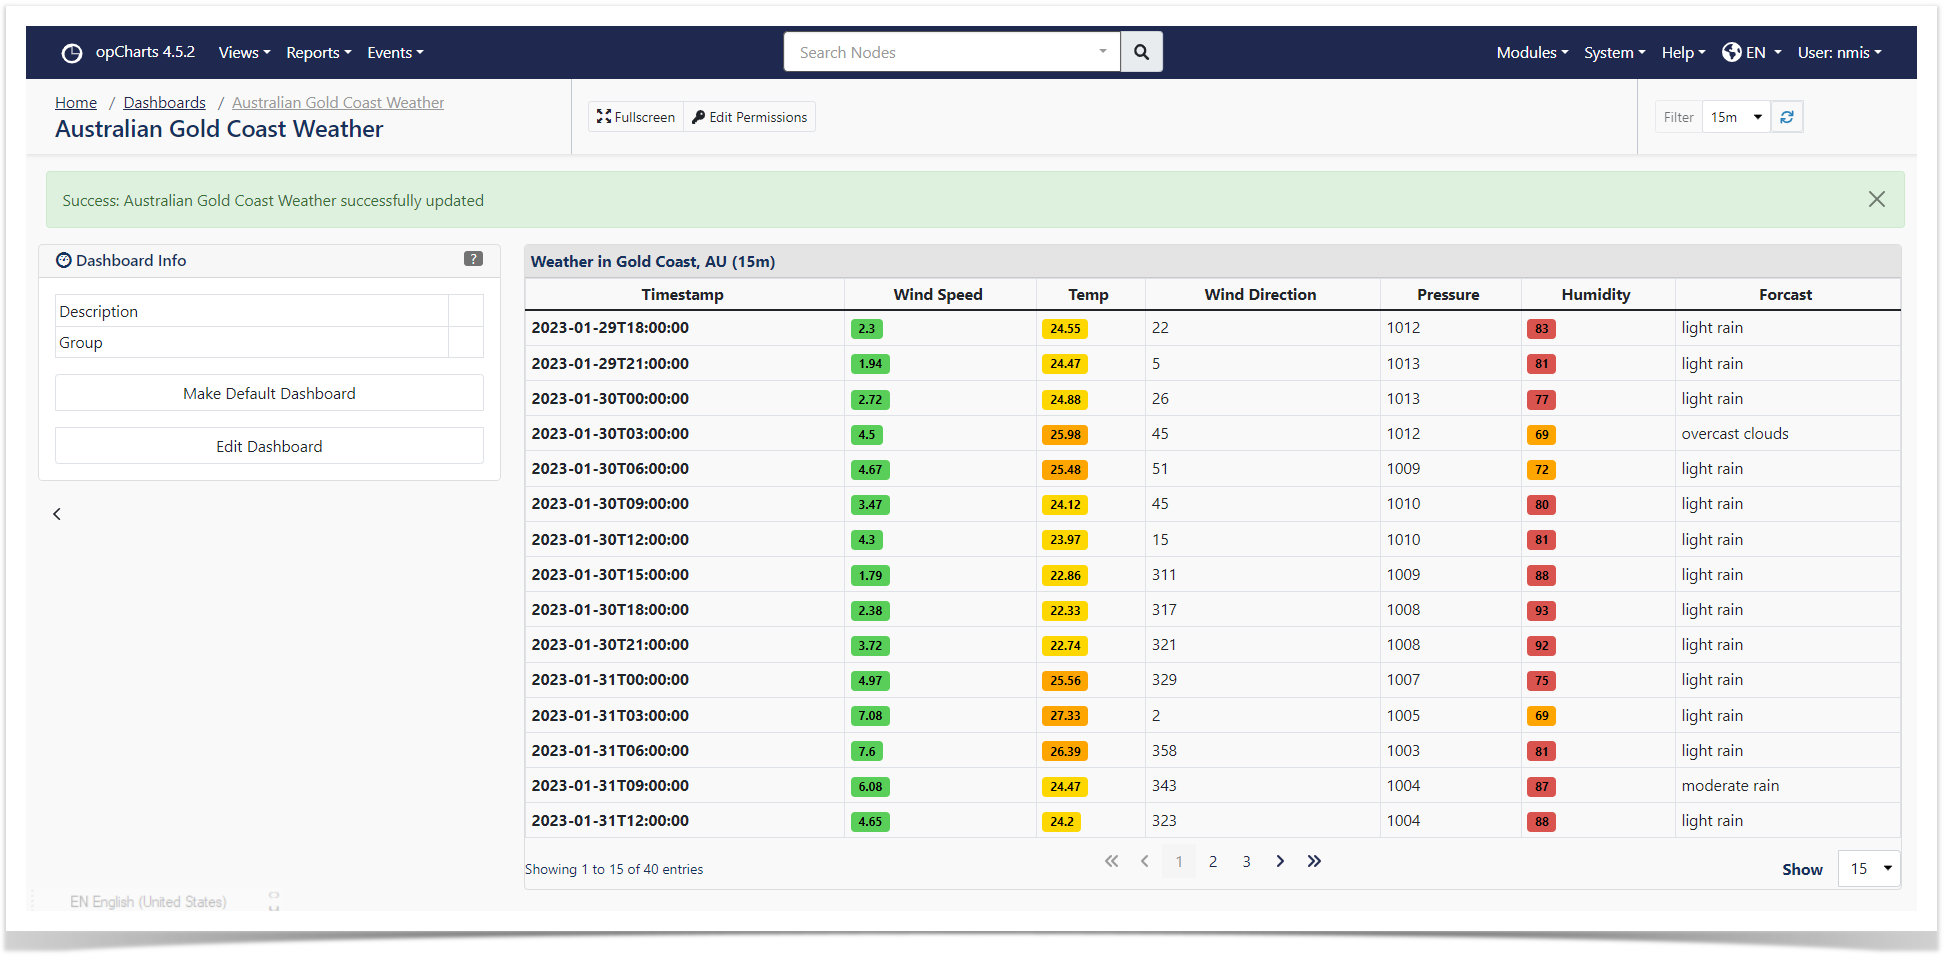
opCharts can display tabular data from most JSON endpoints which required no authentication or support token / bearer header tokens.
In this example we are showing weather data from the Gold Coast using the openweathermap.org API
| Key | Required | Description |
|---|---|---|
| Name | Name of the component which is shown under the opCharts data sources when creating a dashboard | |
| data_source_type | remote_json is used for opCharts to know it needs to make this type of request | |
| model_view | opmantek-remote-json for the table view, opmantek-pie to show the data in a pie chart | |
| options.titleText | Title of the component shown on the dashboard | |
| remote_paramaters.url | URL of your endpoint which returns JSON data | |
| remote_paramaters.auth_type | ||
| remote_paramaters.data_key | ||
| remote_paramaters.pagination | server or client, defaults to server | |
| remote_paramaters.log_request | true or false, omkd_log_level also has to be debug for the web request to written into opCharts.log | |
| private.token | Opmantek Token Auth | |
| table_schema | opCharts - Customising Table Columns | |
| external_url | Hyperlink which displays on the top right of the component | |
| external_url_label | Label for the hyperlink | |
| showLegend | Pie View only, default to true, use false to hide the legen |
/usr/local/omk/lib/json/opCharts/components.d
example_gold_coast_weather.json
{
  "name": "Weather in Gold Coast, AU",
  "data_source_type" : "remote_json",
  "model_view" : "opmantek-remote-json",
  "options": {
    "titleText": "Weather in Gold Coast, AU"
  },
  "remote_paramaters": {
    "pagination": "client",
    "url": "https://api.openweathermap.org/data/2.5/forecast?id=2165087&APPID=__YOUR__API__KEY__&units=metric",
    "data_key": "list"
  },
  "table_schema": [
    { "name": "dt",
      "label": "Timestamp",
      "cell": "String",
      "formatter": "UnixTime",
      "editable": false
    },
    { "name": "wind.speed",
      "label": "Wind Speed",
      "cell": "ColouredByLevel",
      "levels": ["red", 75, "orange", 50, "yellow", 25, "green", 0],
      "editable": false
    },
    { "name": "main.temp",
      "label": "Temp",
      "cell": "ColouredByLevel",
      "editable": false,
      "levels": ["red", 30, "orange", 25, "yellow", 18, "green", 0]
    },
    { "name": "wind.deg",
      "label": "Wind Direction",
      "cell": "String",
      "editable": false
    },
    { "name": "main.pressure",
      "label": "Pressure",
      "cell": "String",
      "editable": false
    },
    { "name": "main.humidity",
      "label": "Humidity",
      "cell": "ColouredByLevel",
      "levels": ["red", 75, "orange", 50, "yellow", 25, "green", 0],
      "editable": false
    },
    { "name": "weather.0.description",
      "label": "Forcast",
      "cell": "String",
      "editable": false
    }
  ]
}
Pie Chart
Showing your own data in the pie chart
Pie Data
{
  "replyData": {
    "data": [{
      "name": "irukandji.opmantek.com:magni.opmantek.com:UDP:32760",
      "y": 56.17
    }, {
      "name": "Other",
      "y": 14.18
    }, {
      "name": "magni.opmantek.com:irukandji.opmantek.com:UDP:32760",
      "y": 10.35
    }, {
      "name": "vgw120-example.com:auto-141.opmantek.com:trivnet1",
      "y": 4.82
    }, {
      "name": "auto-119.opmantek.com:ec2-0.0.0.0.compute-1.amazonaws.com:UDP:45056",
      "y": 3.6
    }, {
      "name": "auto-141.opmantek.com:vgw120-example.com:trivnet1",
      "y": 3.25
    }, {
      "name": "magni.opmantek.com:192.168.1.1:UDP:32760",
      "y": 2.39
    }, {
      "name": "magni.opmantek.com:kraken.opmantek.com:UDP:32760",
      "y": 1.84
    }, {
      "name": "vali.opmantek.com:10.152.0.10:http",
      "y": 1.77
    }, {
      "name": "kraken.opmantek.com:magni.opmantek.com:UDP:32760",
      "y": 1.63
    }]
  }
}
Example component definition to show a pie chart from opFlow
asgard_pie.json
{
  "name": "Pie TopN - Agent asgard",
  "data_source_type" : "remote_json",
  "model_view" : "opmantek-pie",
  "options": {
    "titleText": "Pie TopN - Agent asgard"
  },
  "remote_paramaters": {
    "auth_type": "omk_token",
    "url": "http://example.opmantek.com/en/omk/opFlowSP/agent/192.168.88.254/interface/2/data_model_view.json",
    "requestData" : {
      "data_source": "",
      "dataset_id": 0,
      "model": "opFlow_flows_summary",
      "model_group": 1,
      "model_view": "pie",
      "parameters": {
        "agent" : "5db27d6a731c248b9b953e0a",
        "axis": 0,
        "end_date_raw": null,
        "field": null,
        "filter": null,
        "graph_type": null,
        "group_by": ["src_ip", "dst_ip", "application"],
        "groupby": ["dnsname_src_ip", "dnsname_dst_ip", "application"],
        "interfaces" : {
          "out" : [
             "5db27d6a731c248b9b953e1c"
          ],
          "in" : [
             "5db27d6a731c248b9b953e18"
          ]
       },
        "lineType": "line",
        "summarise": 300,
        "summary_field": "octets",
        "topn": 10,
        "value_column": "octets"
      },
      "translations": [{
        "name": "topn",
        "parameters": {
          "key_columns": ["src_ip", "dst_ip", "application", "app_port"],
          "summary_kvps": ["application", 0, "octets", 2, "packets", 2, "flows", 2, "app_port", 0],
          "topn": 10,
          "value_column": "octets"
        }
      }, {
        "name": "apply_dnsname",
        "parameters": {}
      }]
    }
  },
  "private": {
    "token": "whateverSuitsU!"
  }
}
How to use the widget
The first step to create a new component is to add the json descriptor file in the path (A content example can be seen in the example above):
omk/conf/components.d/new_component.json
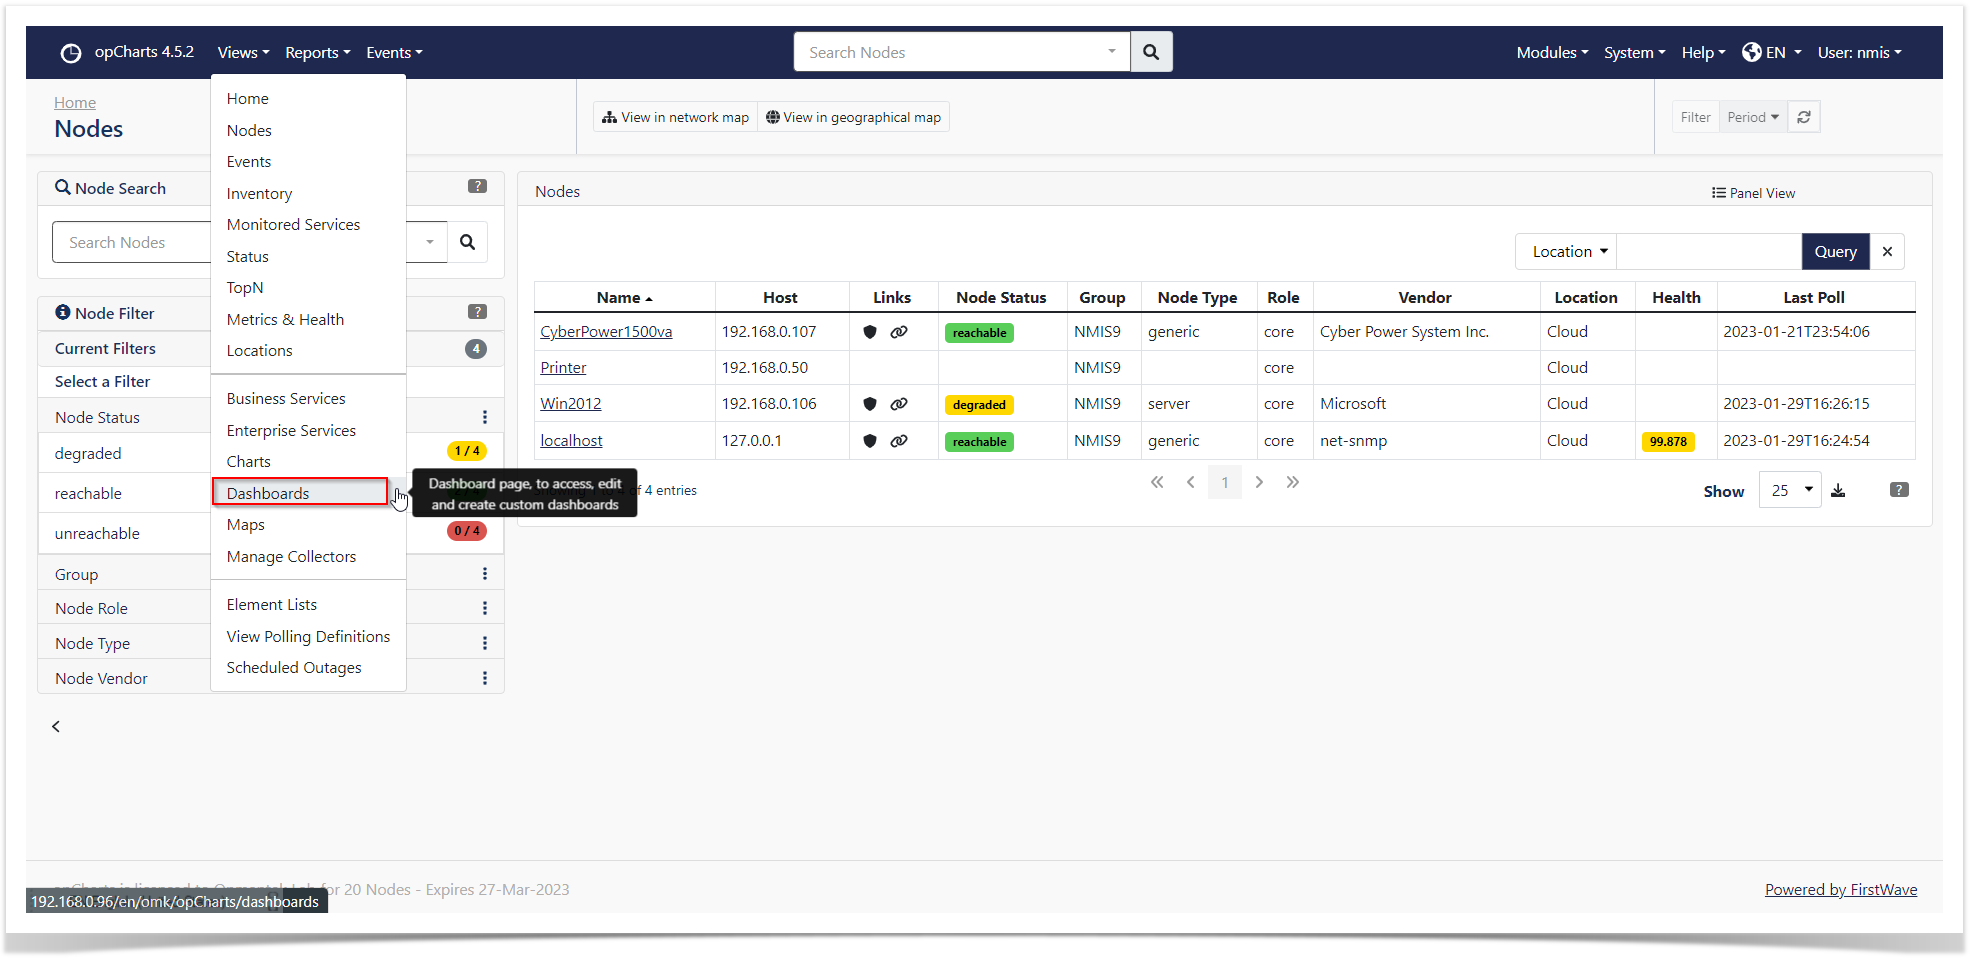
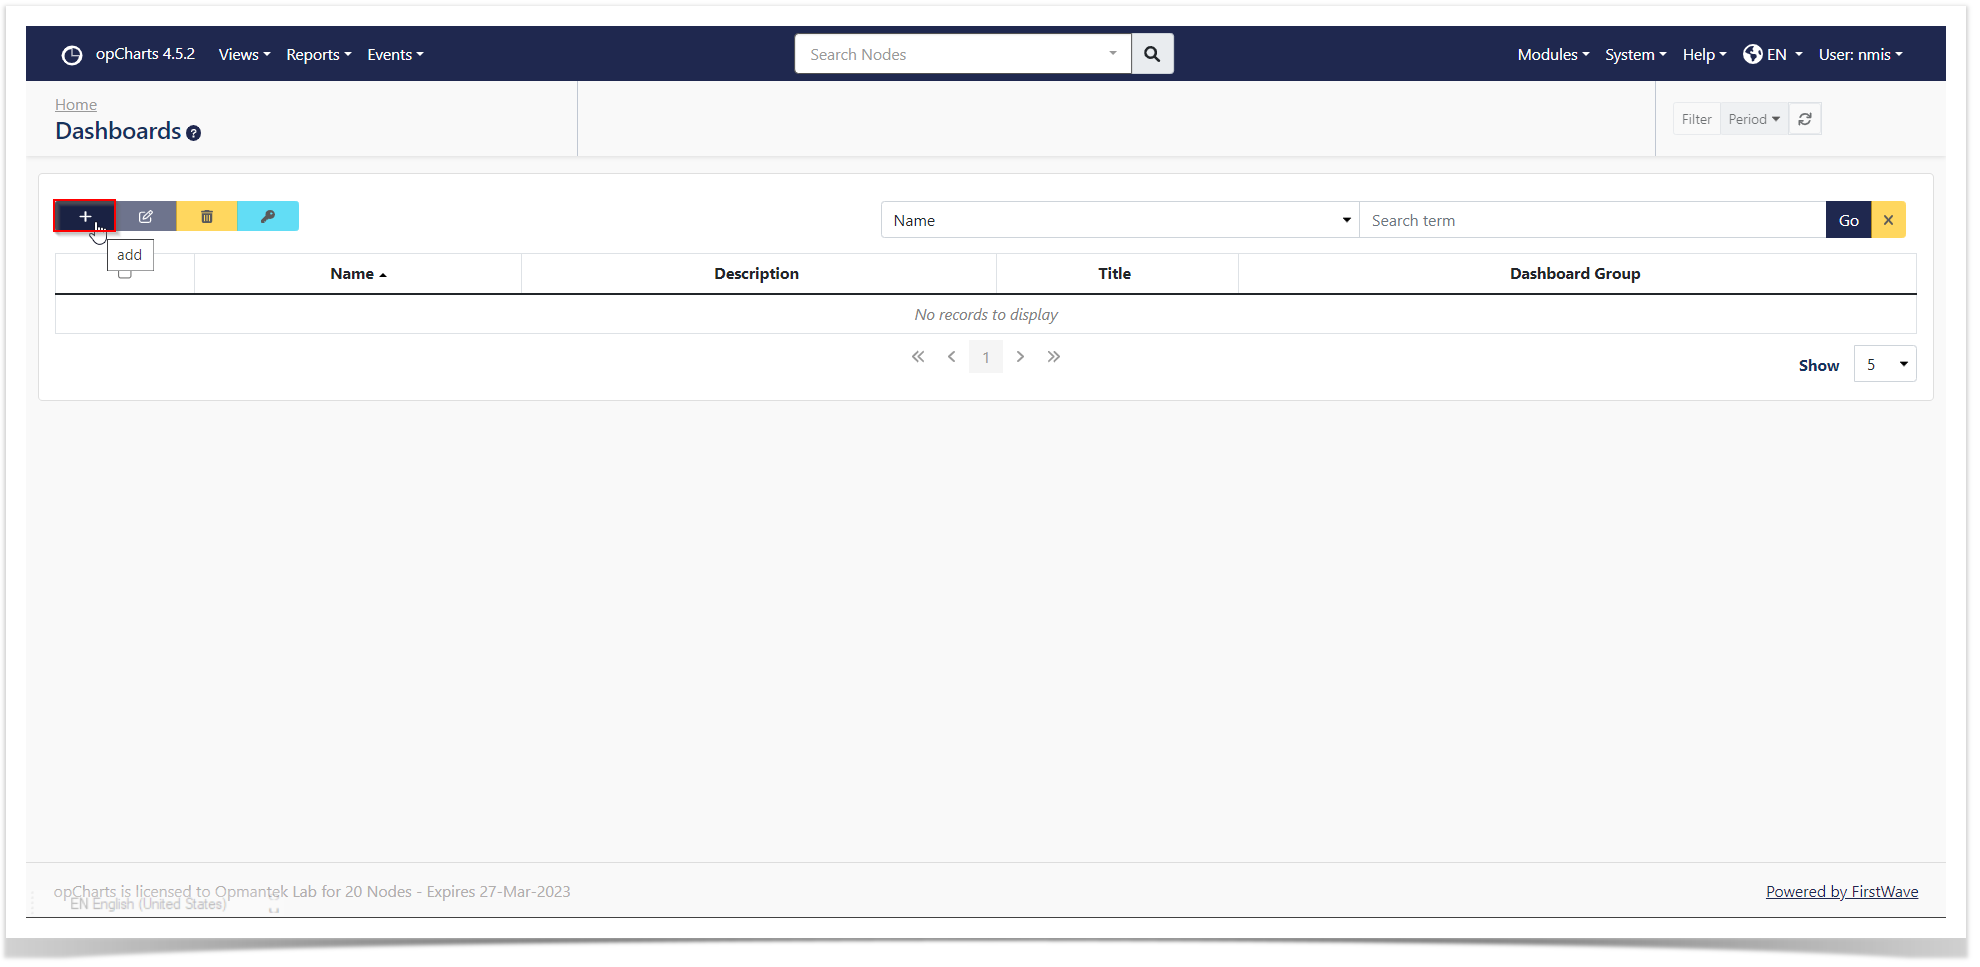
Once the file is created it can be used as a component in a Dashboard.