...
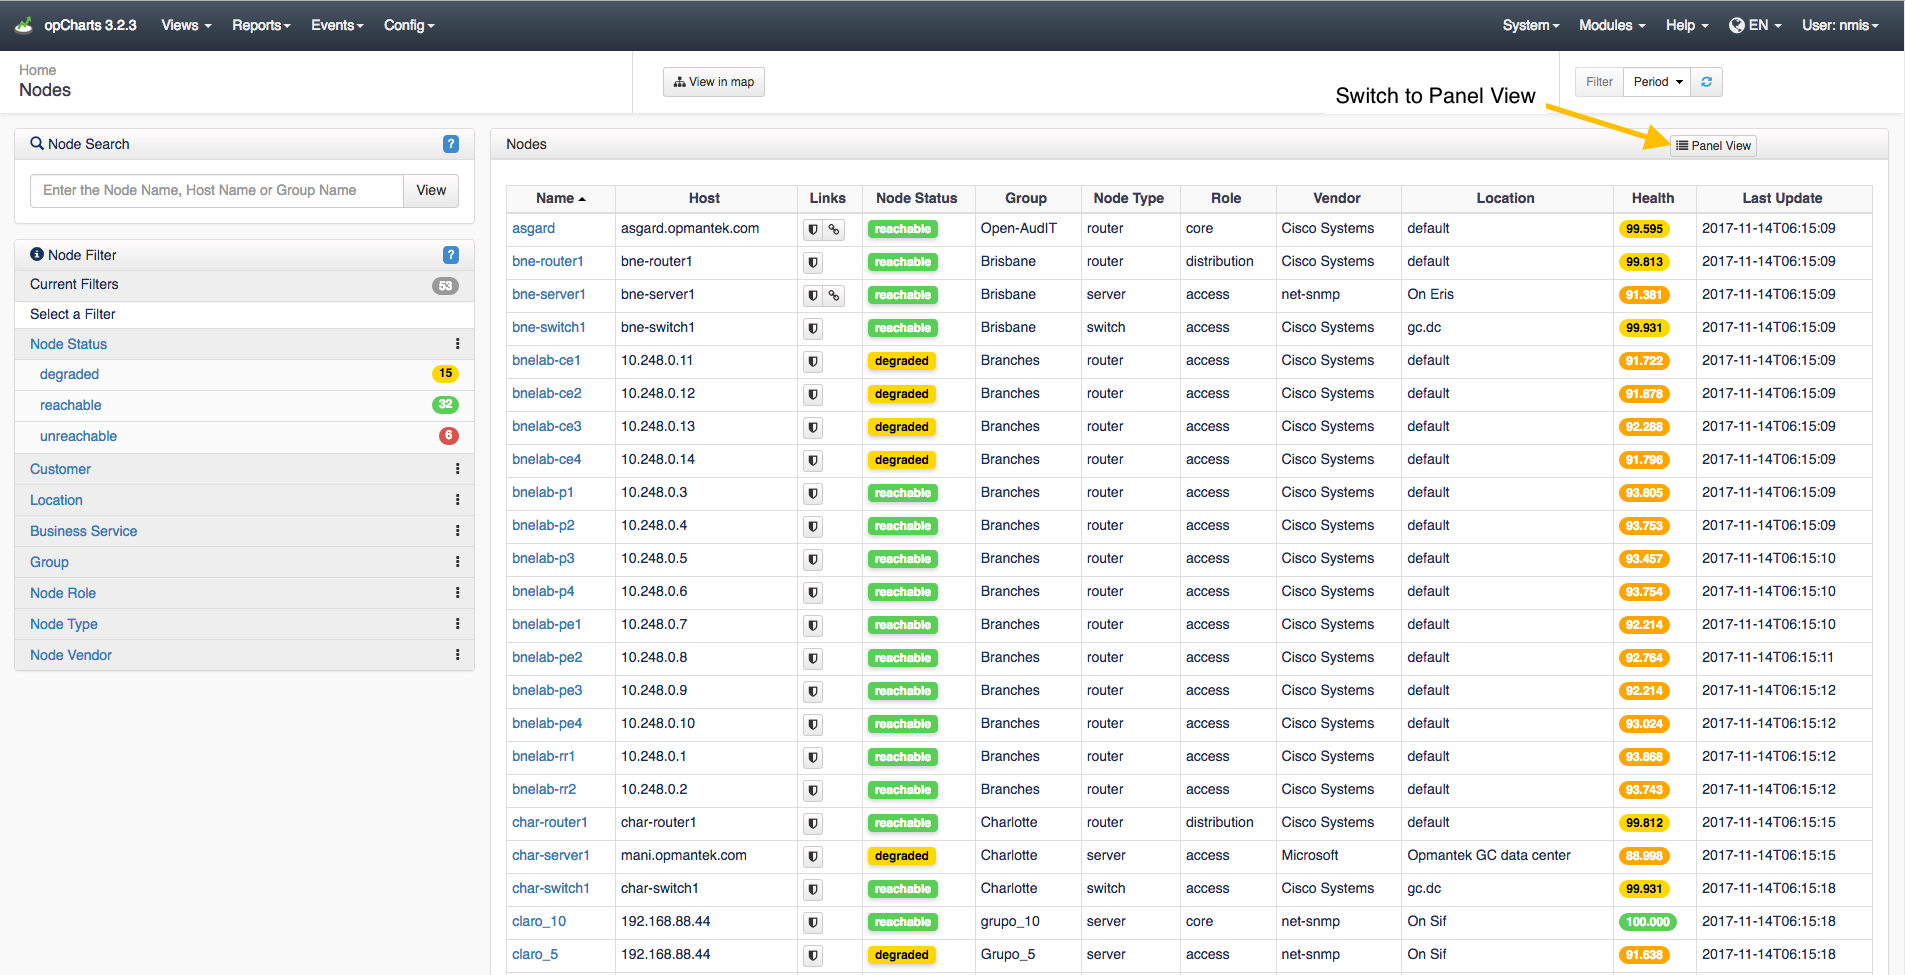
To open the Nodes View, select Views -> Nodes from the opCharts menu bar. By default, this displays a list of all nodes in your environment, but you can also select Panel View to abstract each nodes performance information into easy-to-understand panels. These panels include such information as the node name, node status, vendor, and key performance information regarding each node.
*Note* The Nodes view is the default view for opCharts unless a default Dashboard has been assigned to the user account.
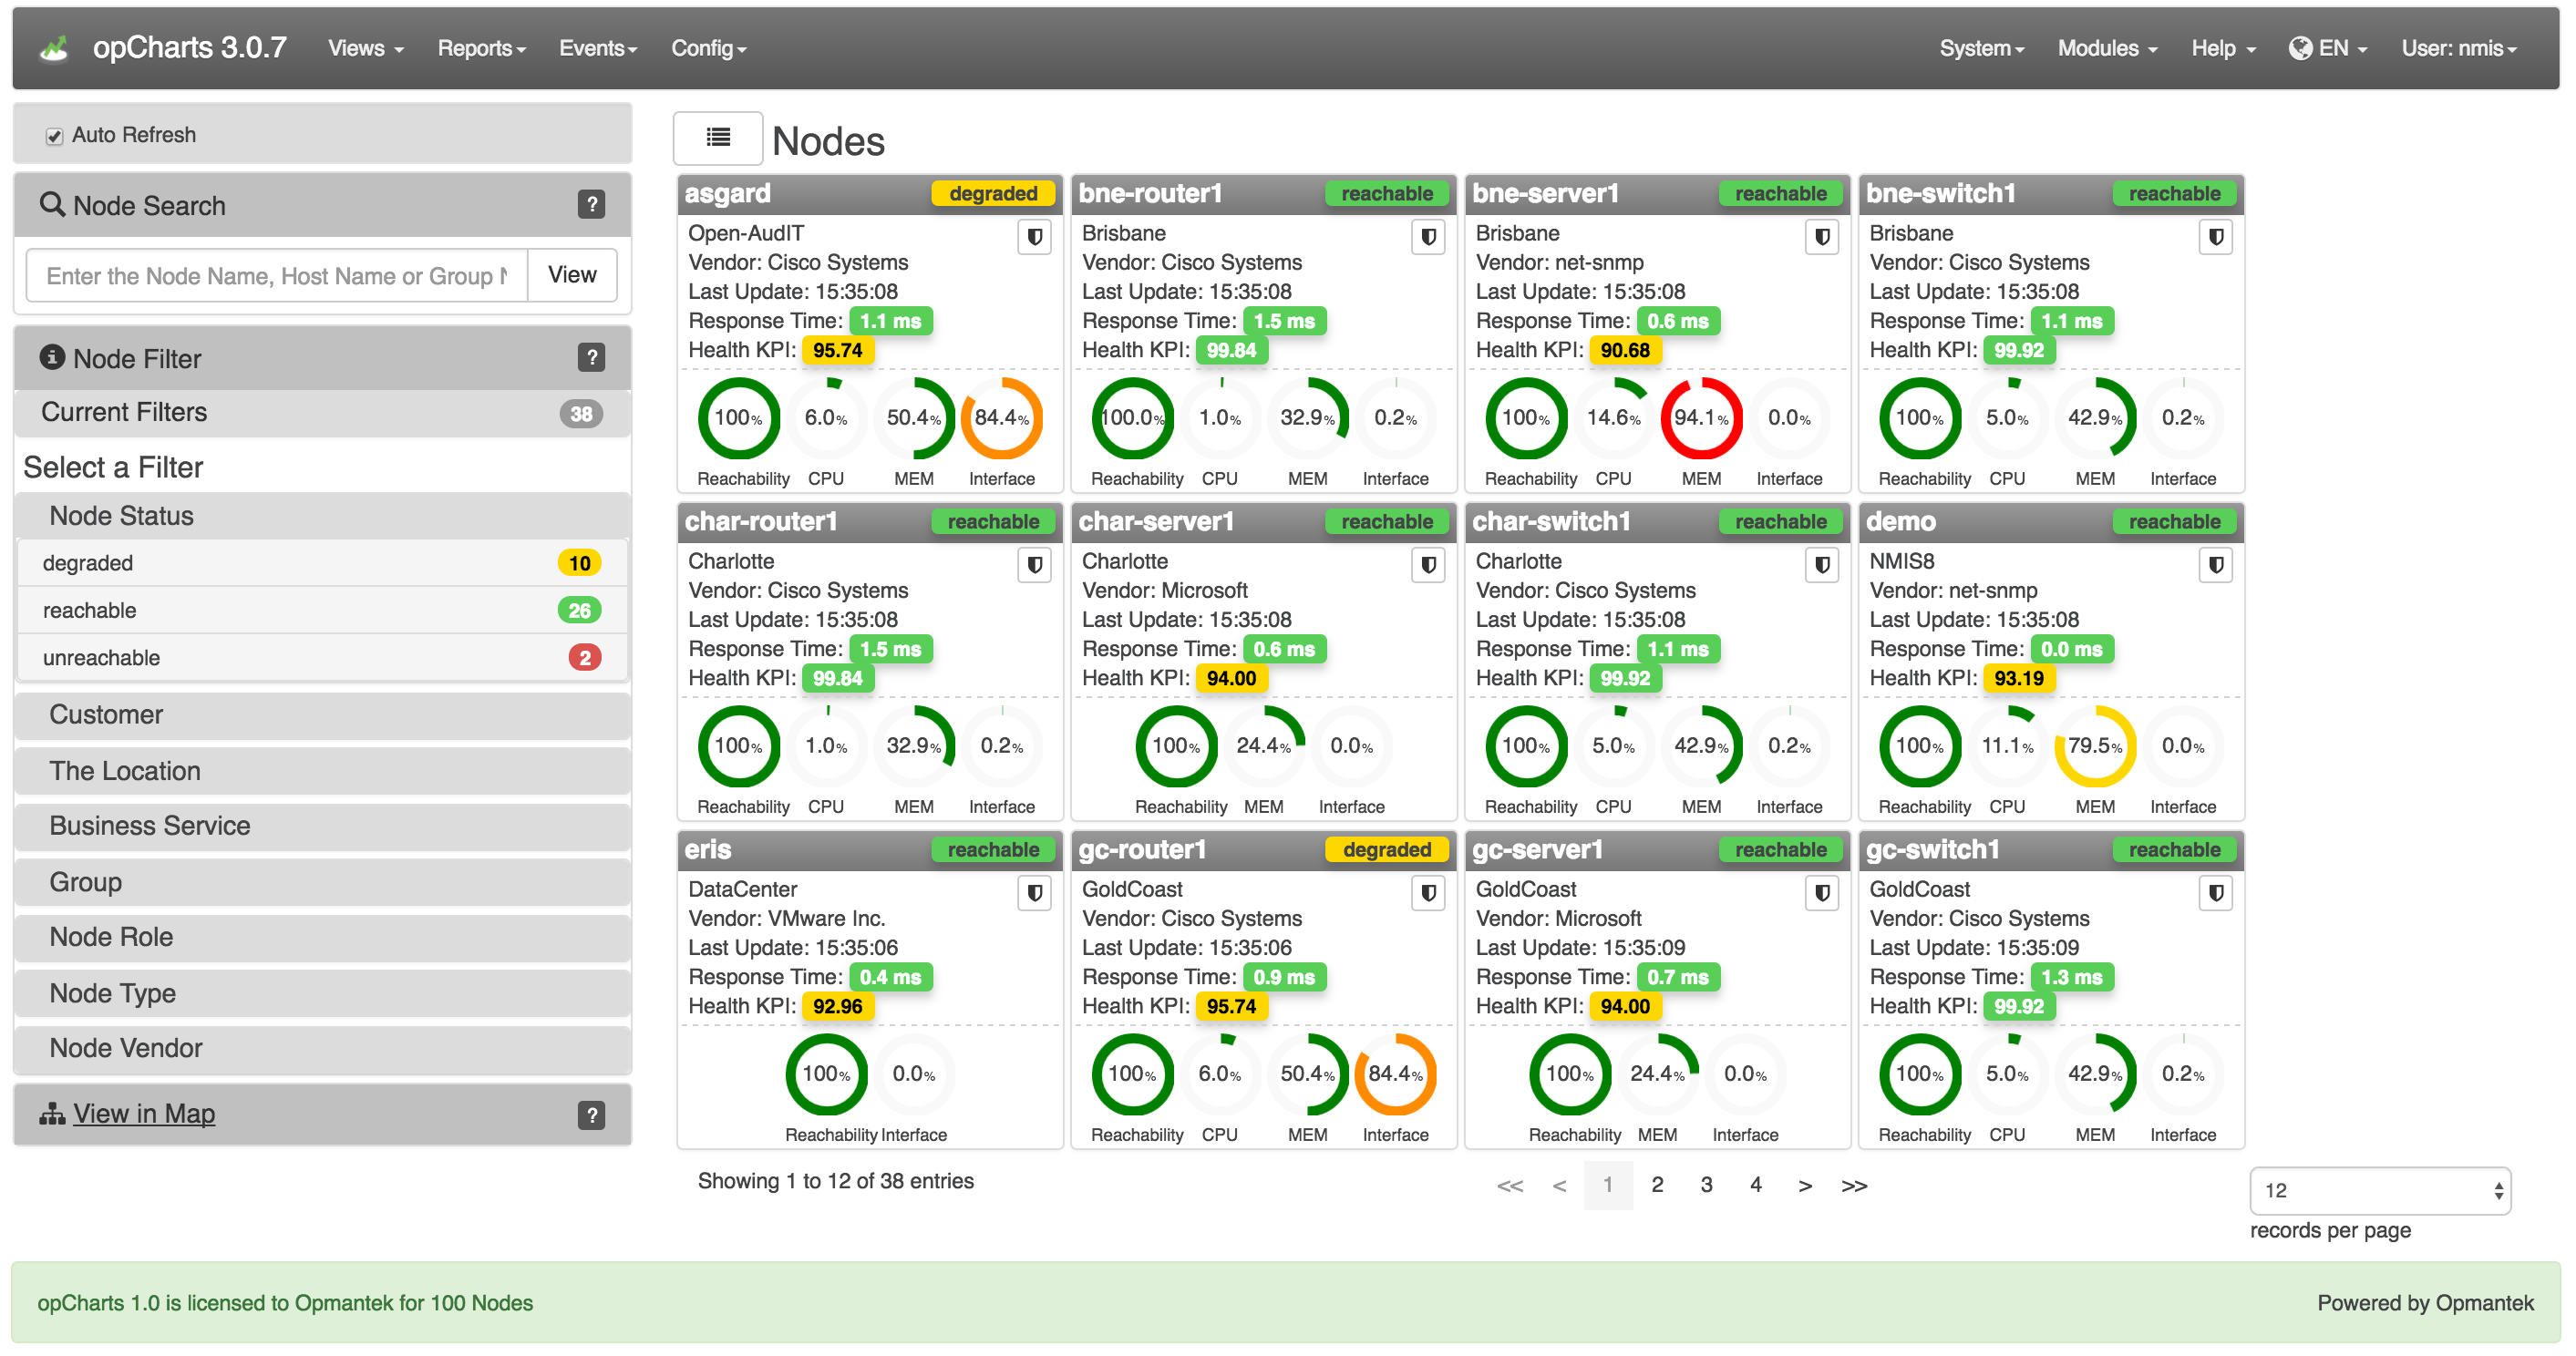
Panel view
In this view each node is represented by a panel versus a line in a table. Each panel provides important information for the represented node. Some of this information is conveyed via dials. There are two options to chose from in regard to how data is displayed in the 'node panel dials'. Please refer to the administration guide in order to switch between the two panel dial options.
...
In this mode the dial represents the amount of resource consumption. In the example below the CPU utilization for asgard is at 6%; a desirable and the dial is green. The memory usage of bne-server1 is at 94.1%; an undesirable condition and the dial is red.
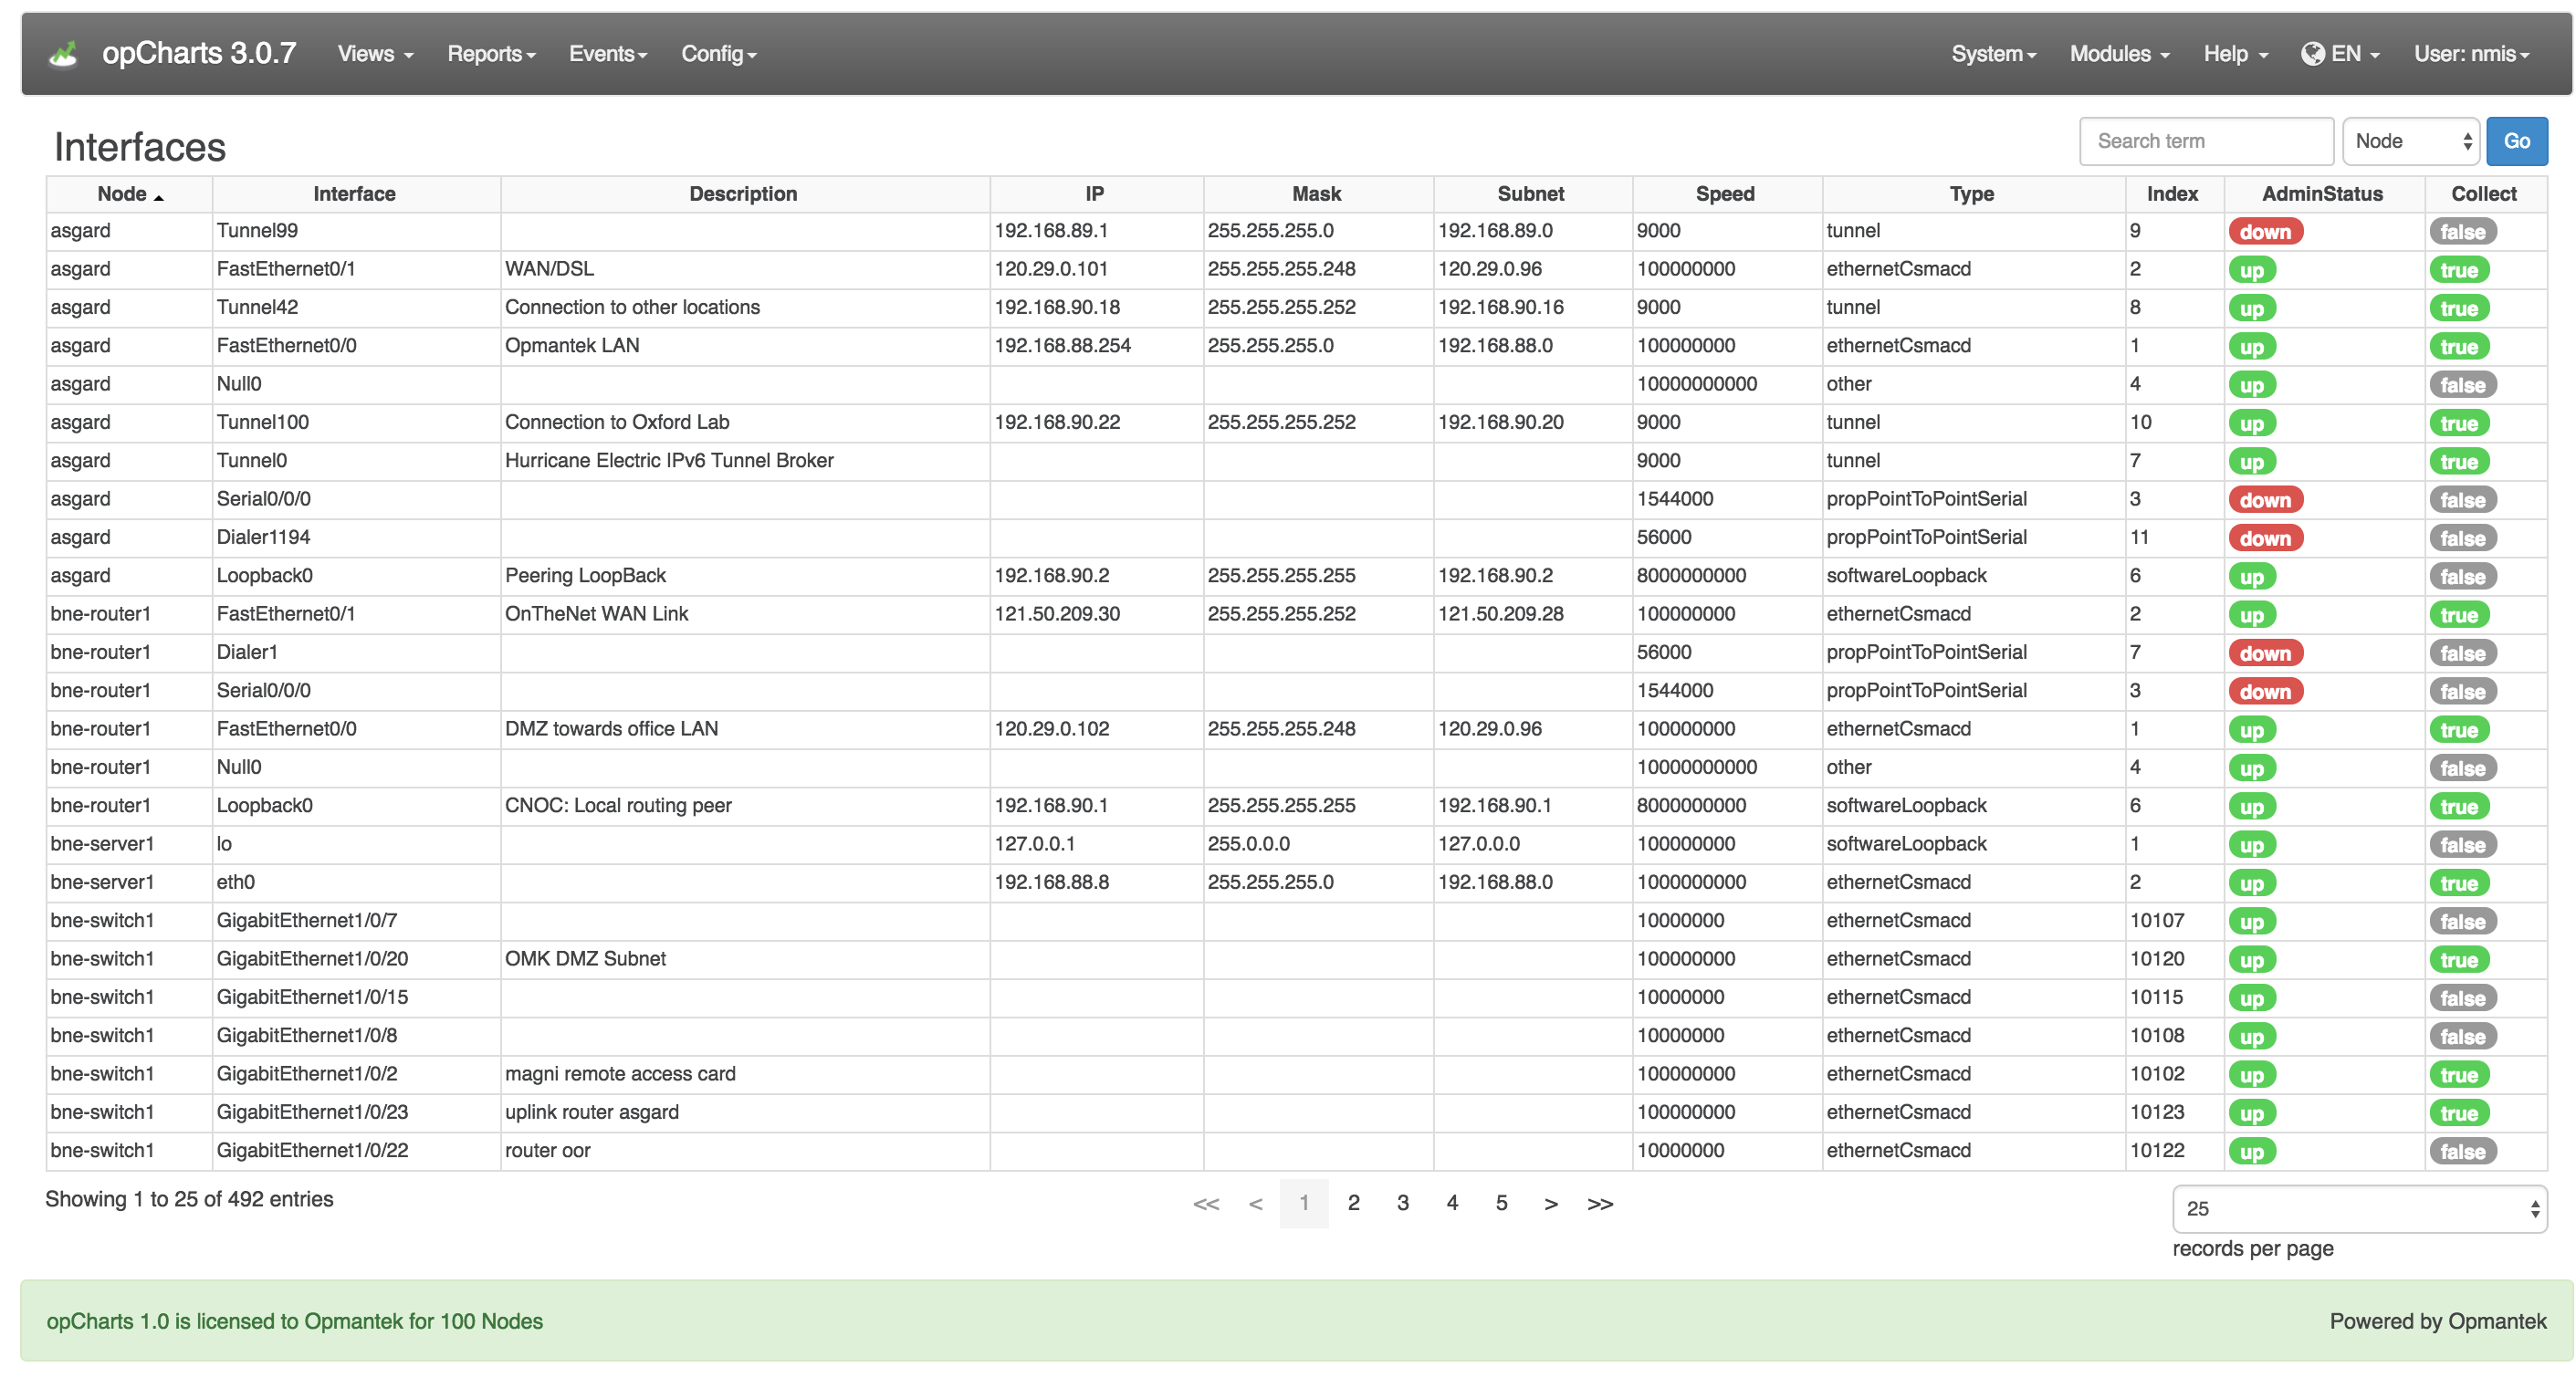
Interfaces View
To open the Interfaces View, select Views -> Interfaces from the opCharts menu bar (Views → Inventory in opCharts 4). This view provides an easy-to-search list of all interfaces in your environment. From here, the user can drill down into the details of individual nodes and interfaces.
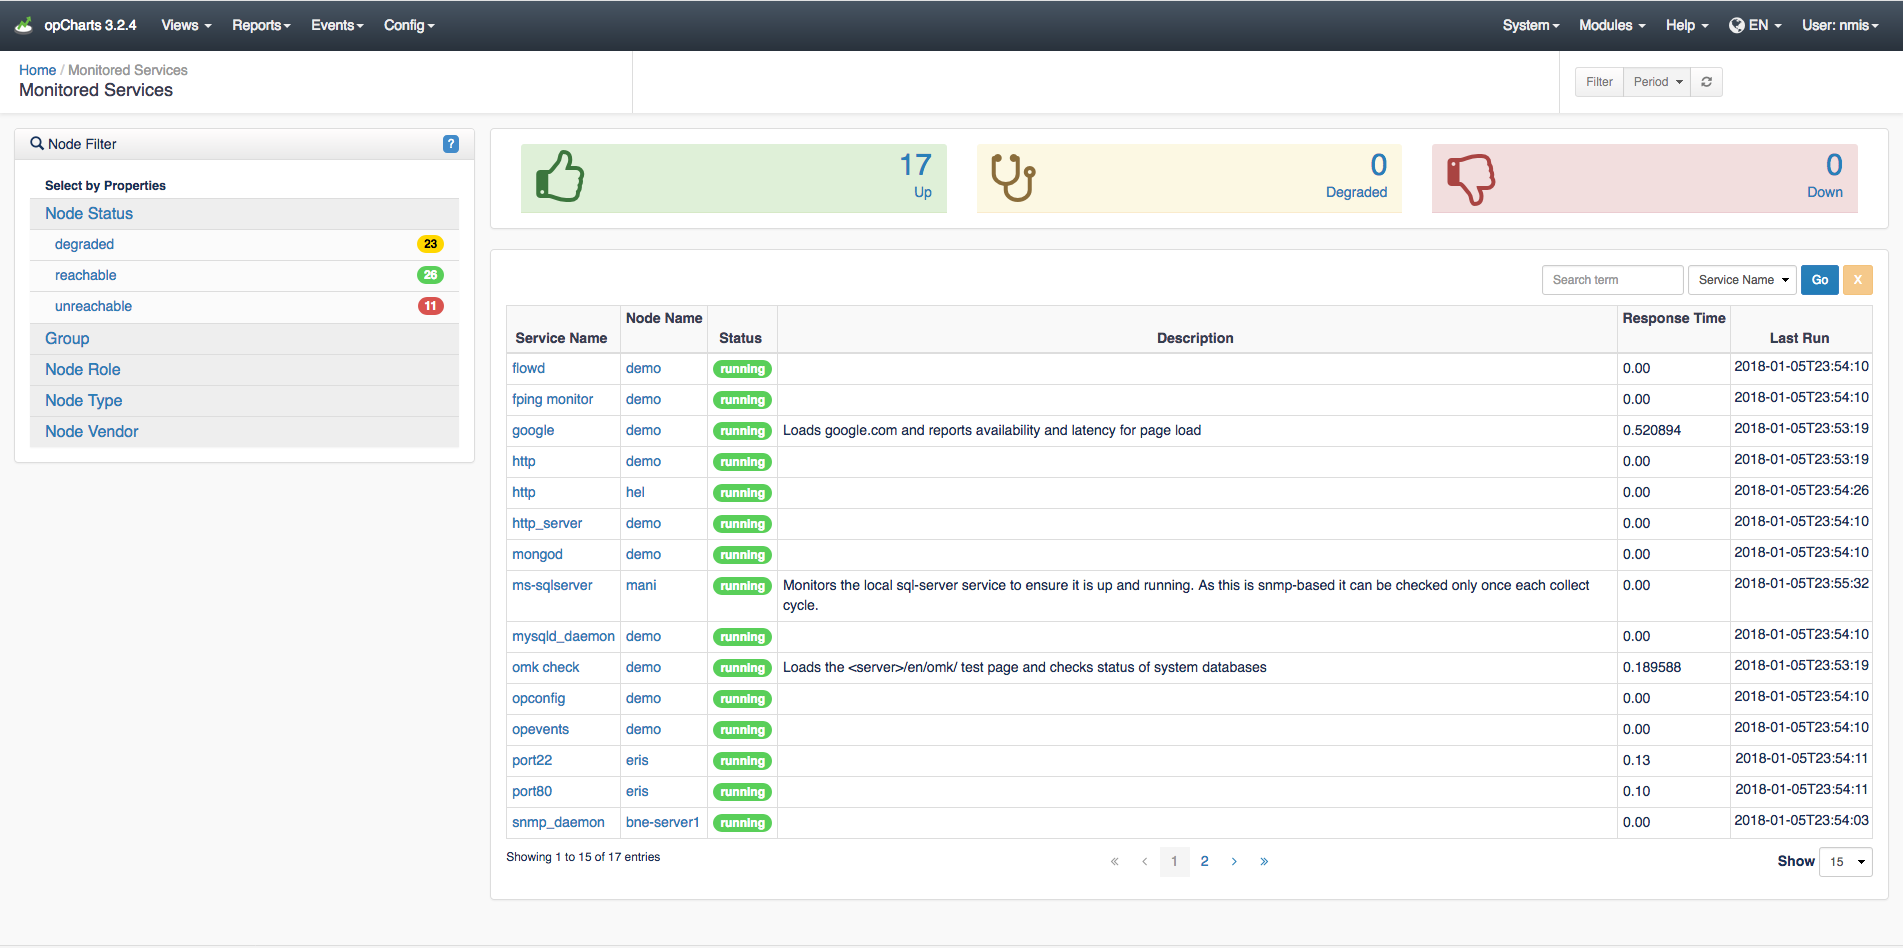
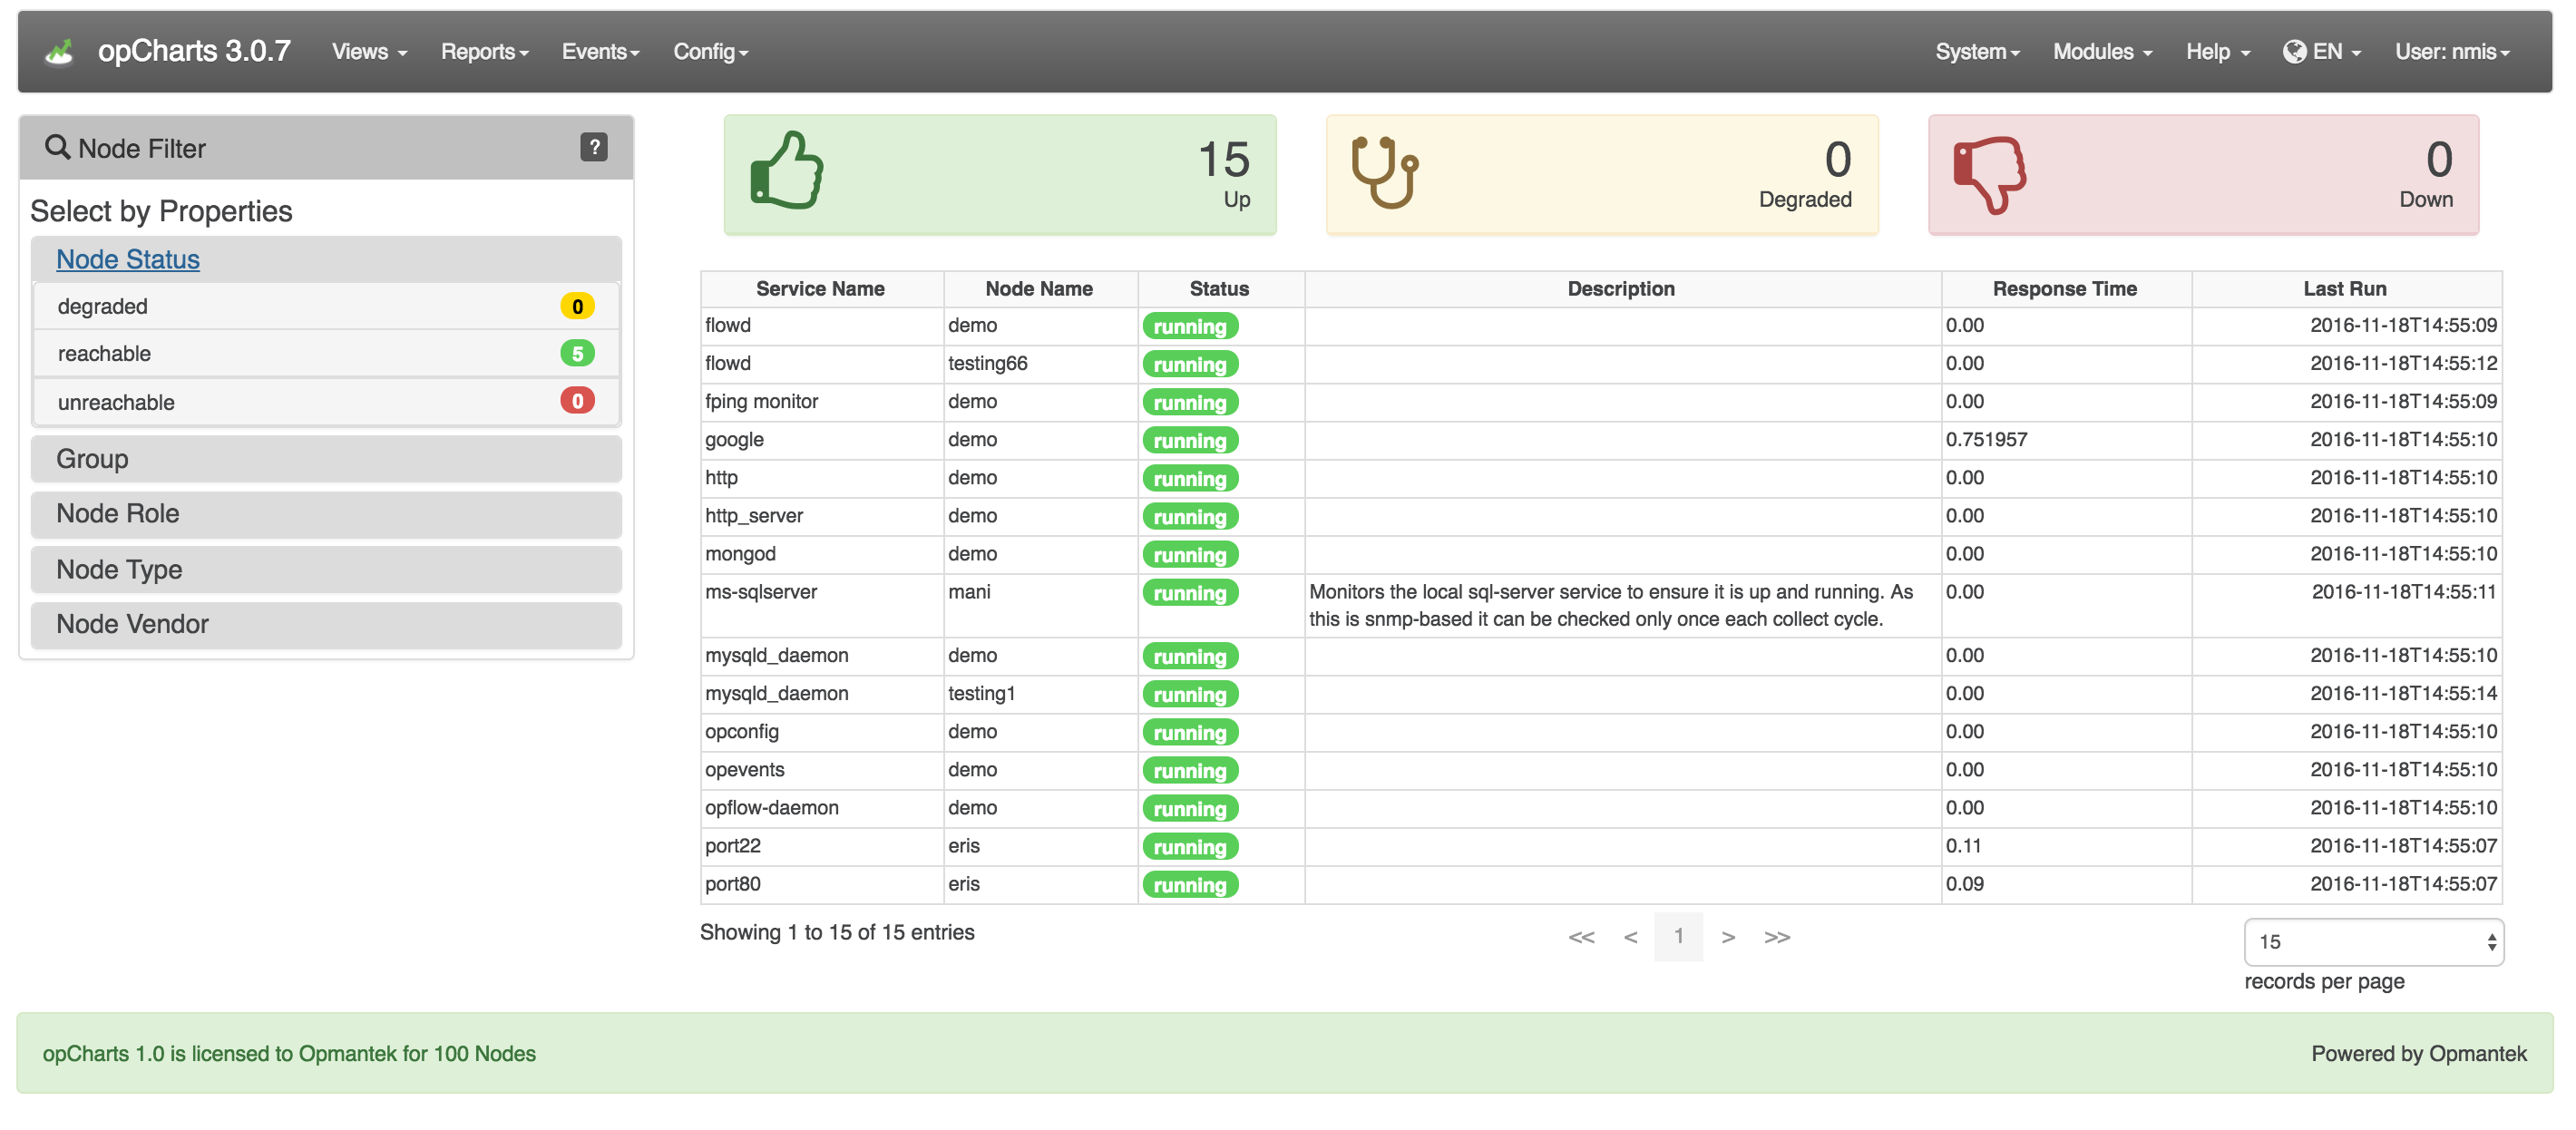
Monitored Services View
To open the Monitored Services View, select Views -> Monitored Services from the opCharts menu bar. Services can be filtered by groups such as node status and group and as of opCharts 3.2.2 you can do a search of the monitored services list.
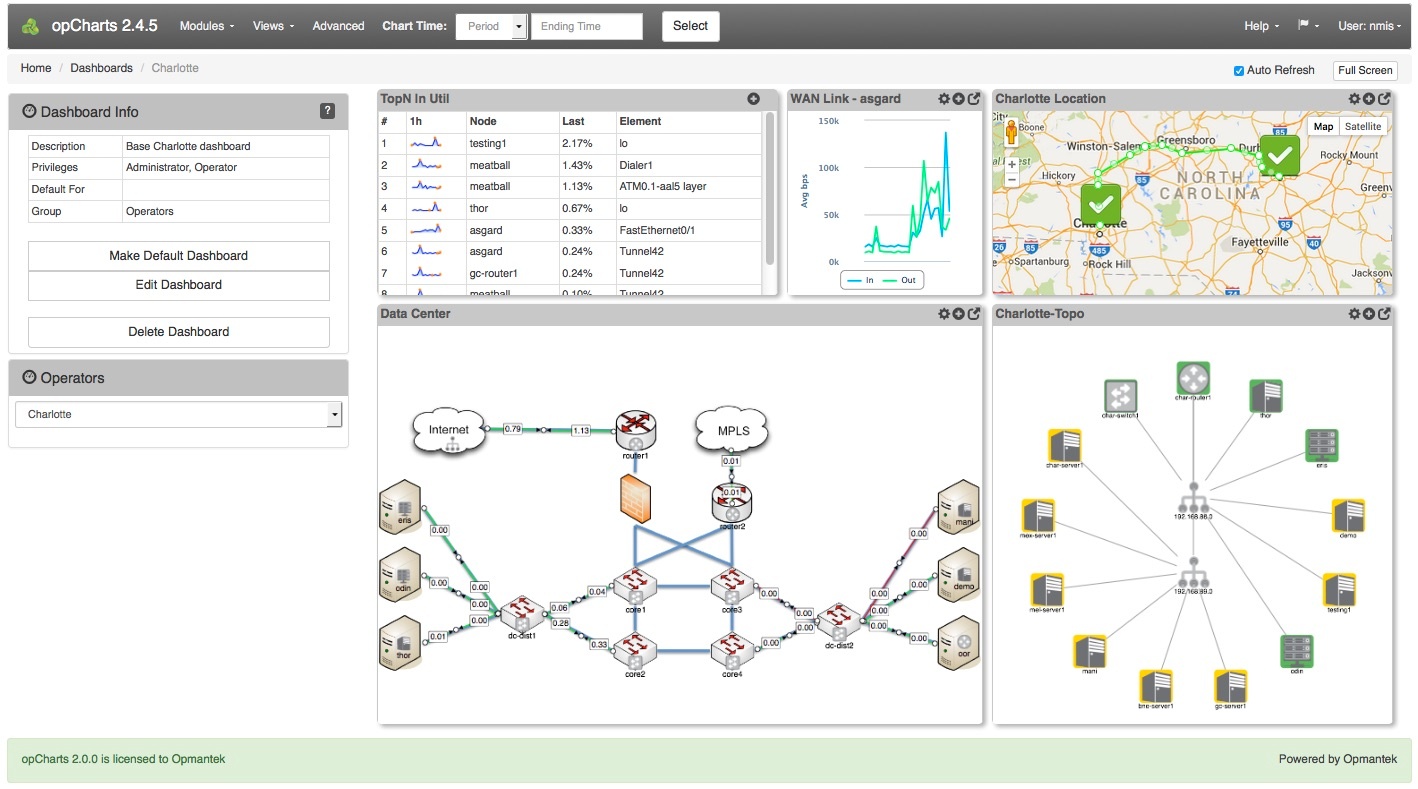
Dashboards View
To list all available Dashboards, select Views -> Dashboards from the opCharts menu bar. From there, the user can select to create a New Dashboard, and View/Edit/Delete an existing Dashboard.
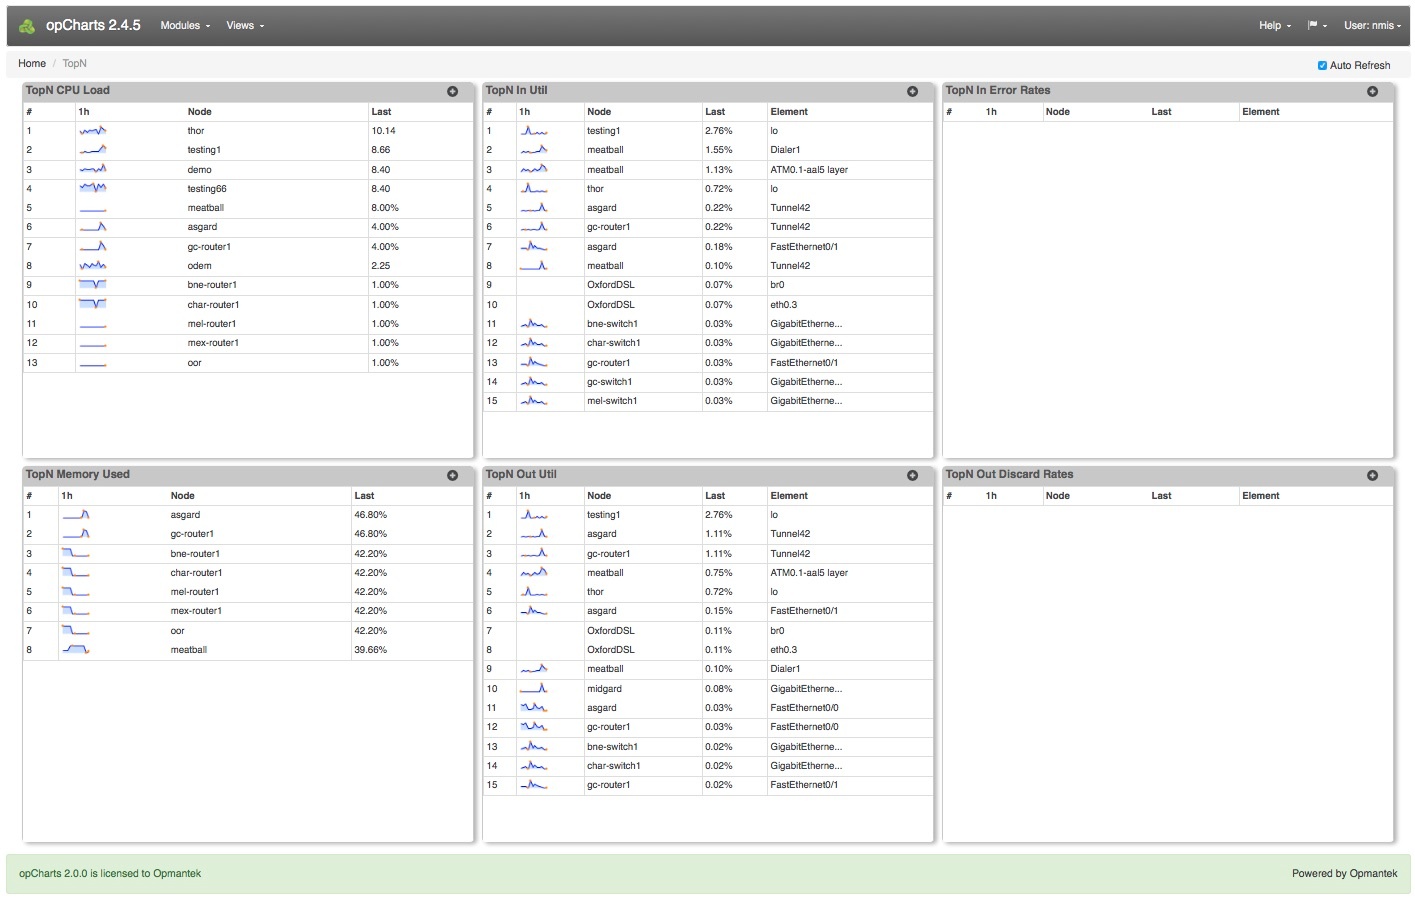
TopN View
The open the TopN View, select Views -> TopN from the opCharts menu bar. The TopN view is actually a collection, or predefined dashboard, comprised of six opCharts Components. Any of these TopN charts can each be added to a new or existing Dashboard (see: Dashboards for more information) to create custom views. The small graphs for each TopN are called "sparklines", they give you an impression of the full graph which you can see by clicking on the TopN.
Detail Pages
Please see these additional pages for more detailed information on using opCharts.
| Children Display | ||
|---|---|---|
|