...
Lets say the interface can transfer 2 mb/s, so in 2 min it can transfer (2*60*2) 240mb. 10mb/240mb = ~.04 or 4%. Understandably this may not be how a network engineer would think about the data (in amount transferred). opFlow has an option to display the graph in bits/second instead of just bits. The config option 'opflow_gui_graph_over_time_per_sec' => 1 changes the graph.
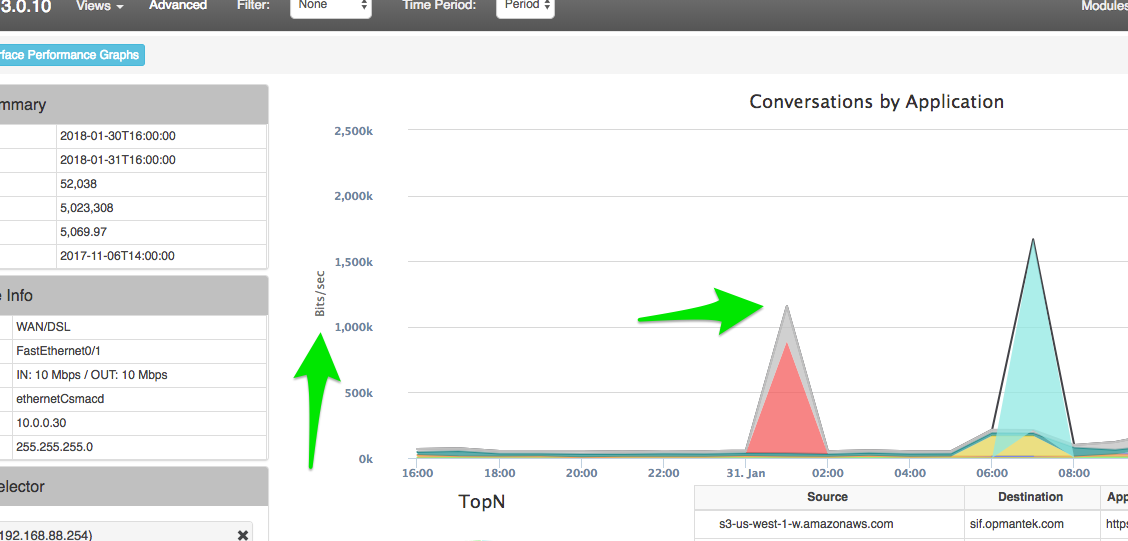
The images below show examples of charts displaying in Bits vs. Bits/Sec to highlight the difference that the config option opflow_gui_graph_over_time_per_sec makes. The first image directly below is displaying in Bits.
This second image is displaying a graph in Bits/Sec for the same data and time period. You can see in the summary box on the left of the images above and below that it is indeed using the same data and Time Periods.
A brief description of key items to help in understanding opFlow information:
...

