...
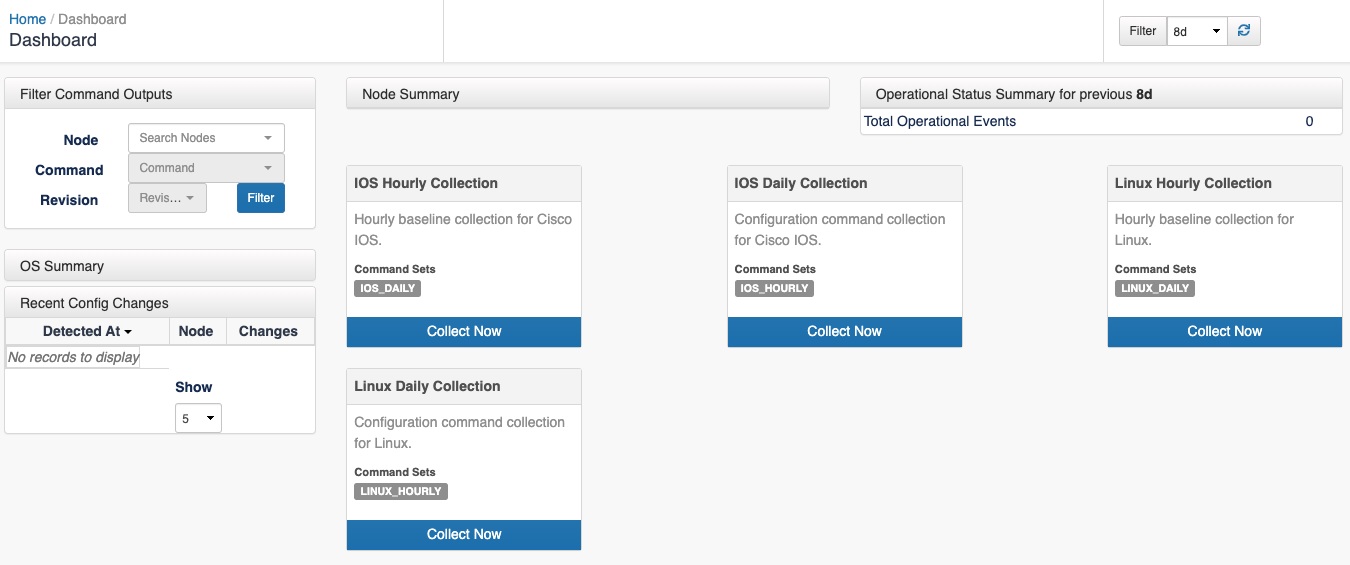
Once we introduce the license we will see the first screen of opConfig, the dashboard, that will be empty for the moment:
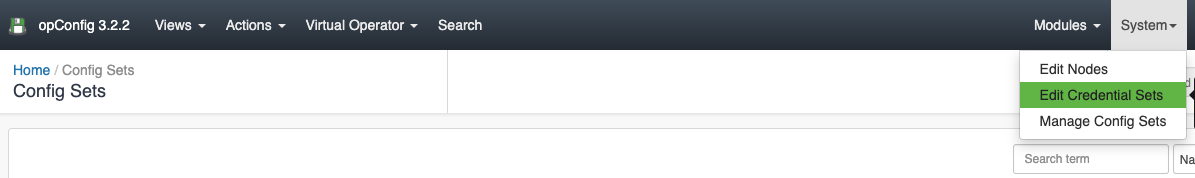
opConfig Menus
...
Views
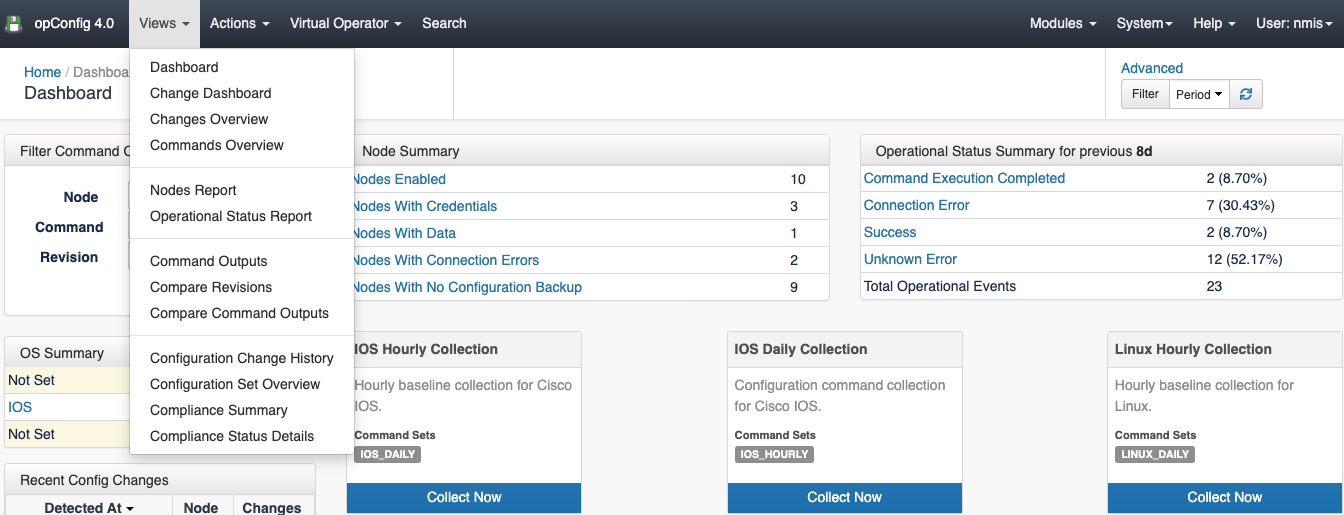
In the views menu we have the following views:
- Dashboard: opConfig landing page were we can see a Summary of the nodes report, last changes and scheduled jobs.
- Change Dashboard: A Dashboard with the recent commands and configurations. These commands are the ones tagged with detect_changes.
- Changes Overview: A table with the recent config changes.
- Commands Overview: A table with the recent commands run.
- Nodes Report: A table with the nodes information, when was the last change done for a node, information about the OS, etc.
- Operational Status Report: Overview of what opConfig is doing to which nodes, when, and how successful it was with these operations.
- Command Outputs: See the result of a command run in a node, for a specific revision.
- Compare Revisions: Compare different versions of a command.
- Compare Command Outputs: Compare the result of a command run.
- Configuration Change History: A history of the configuration changes performed. Here you can read further regarding how to automate configuration changes.
- Configuration Set Overview: A list of all the configuration sets, imported using the opconfig cli tool.
- Compliance Summary: A list of all the compliance policies. Here you can find further information about opConfig, compliance management and Open Audit integration.
- Compliance Status Details: The status of the compliance policies.
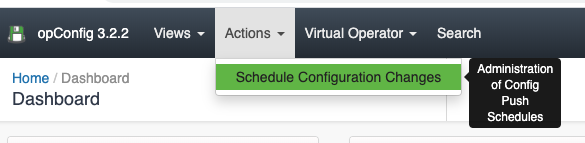
Actions
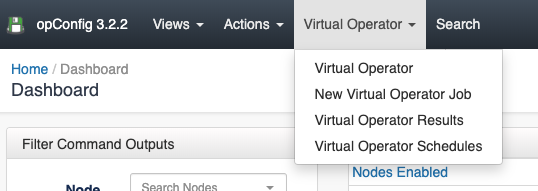
Virtual Operator
Nodes Management
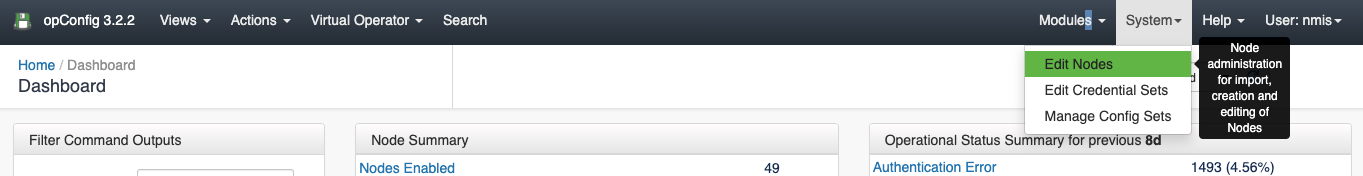
Credential Sets
Related readings
...