...
More detail on which Actions can be managed can be found here: Event Actions and Escalation (opEvents 4)
Raw Logs View
The Raw Logs view displays the current raw event logs. This view is useful for viewing what the full event message says within the Entry column. Clicking the Event ID link will open up the Event Details page for the chosen event.
...
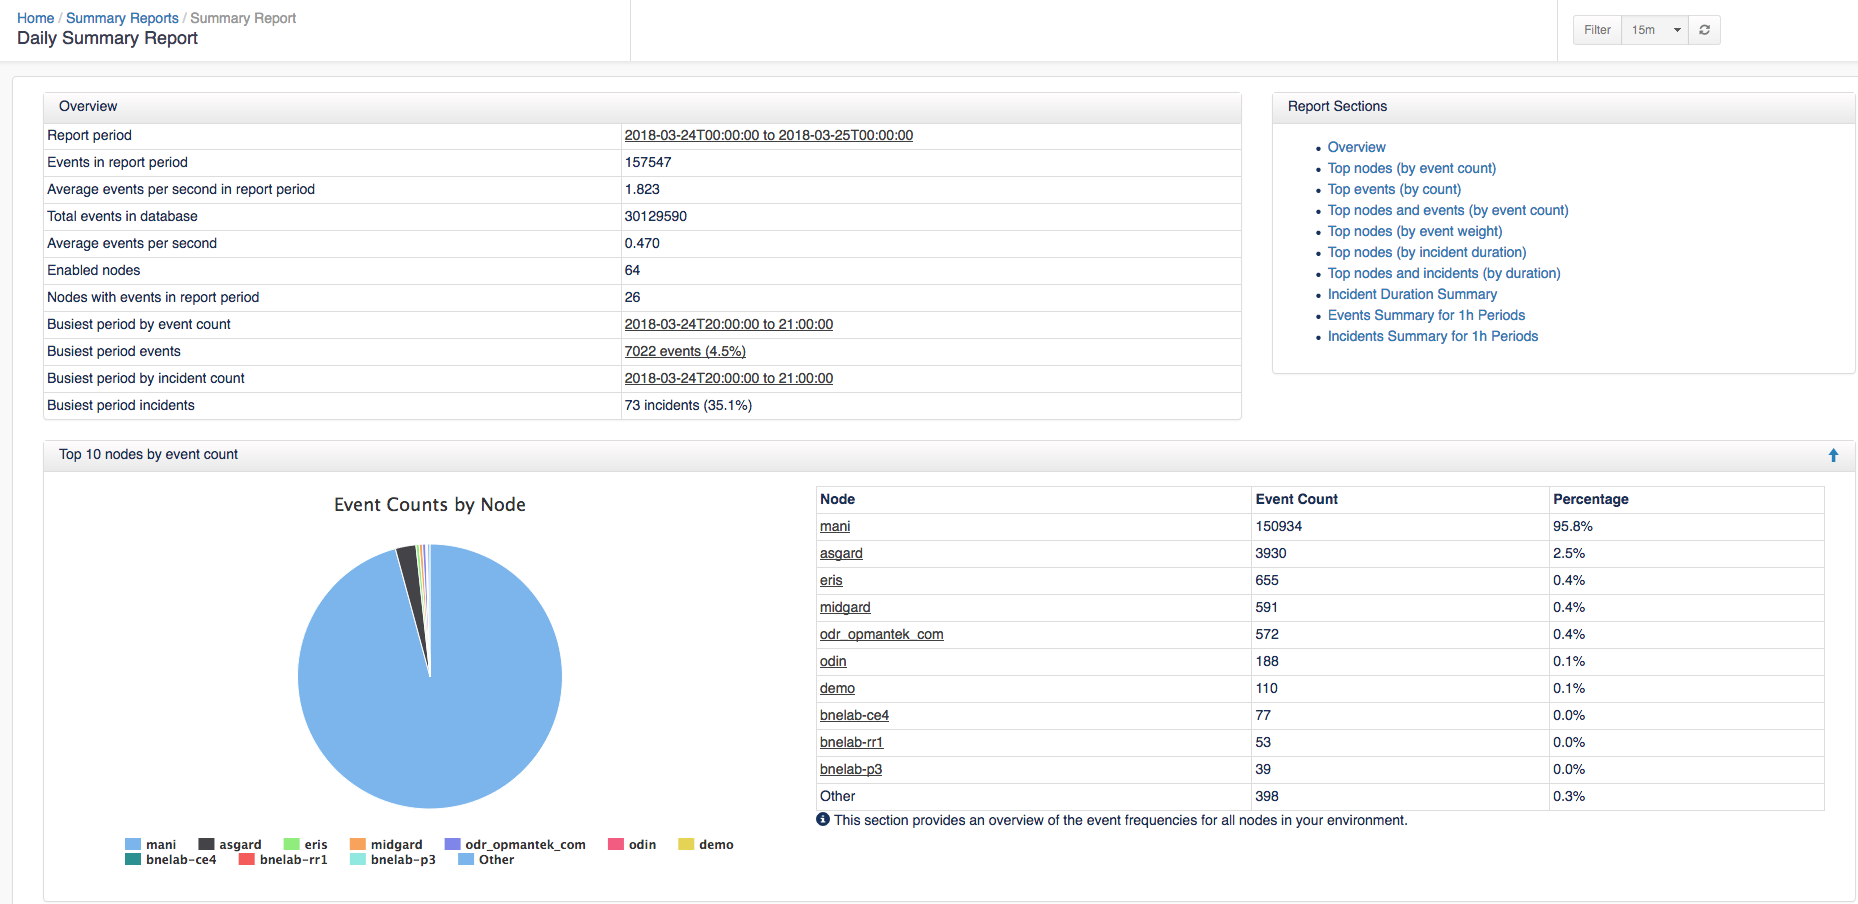
To view a report click on a link in the Title column or Download the file. The Summary displays: Overview, Top 10 nodes by event count, Top 10 events by count, Event Priorities by count, Top 10 nodes and events by event count, Top 10 nodes by event weight, Top 10 nodes by incident duration, Top 10 nodes and incidents by duration, Incident Duration Summary, Events Summary for 1h Periods, and Incidents Summary for 1h Periods. To see what the full report looks like you can download an example report HERE.
Time Filter
The top right hand corner of the screens has a Filter widget with three buttons:
- Filter for Advanced Filters - Time Filters, Event Filter and Summarisation
- Period for Quick Time Period Filters
- Toggle for Toggle Auto Refresh
