Table of Contents
Table of Contents
Overview
opCharts enables you to build dynamic interactive charts and targeted custom dashboards for single-pane-of-glass views into your NMIS data. It increases your network visibility and accelerates root cause discovery by combining multiple data sets on its adaptable graphical interface.
You can create one such dashboard to monitor Enterprise Services too, which allows you to view Interface and Node status panels on a single page. You can also group any related Interfaces/Nodes together to view them all at one location. Further, the MSP authorization system supports the Enterprise Services when added as a dashboard component.
Service Metrics
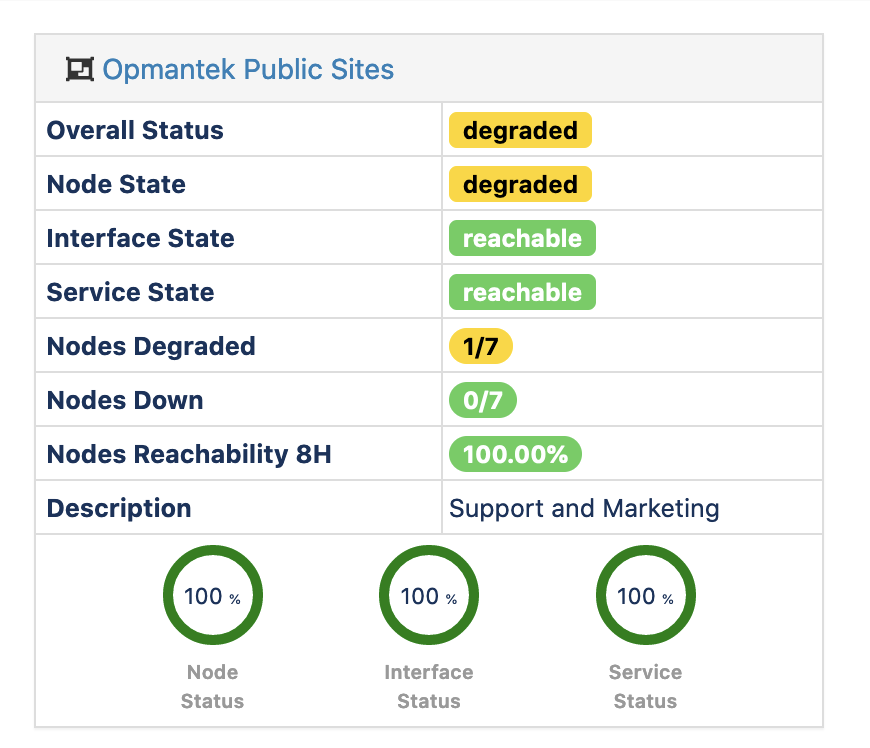
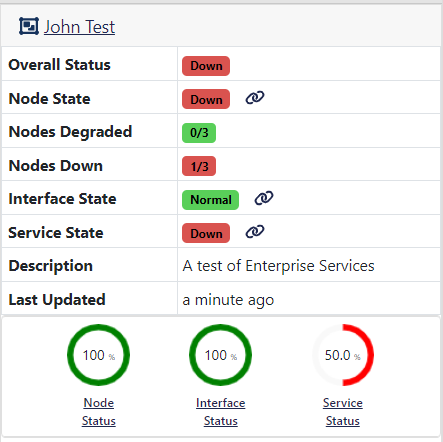
- Node Status:The Node Status is calculated from the status events for the NodeNodes. It aggregates the status event levels and presents an average of the same0% to 100%.
- Node State: If any Node is unreachable, the Enterprise Service Node State is marked Unreachable Down. If a any Node is Reachablereachable, but it is not at its optimal level/health, the Service Node State is marked Degraded, otherwise it is Normal.
- Interface Status: The Interface status Status is calculated by aggregating all the Interface-related status event levels and averaging them out 0% to 100%.The Down Metrics shows all the Interfaces marked as Interface Down. It stores a count of such Interfaces.
- Interface State: If any Interface is marked Interface Down, the Enterprise Service Interface State is marked Unreachable Down, otherwise it is Normal.
- Monitored Service Status: The Service Status shows the aggregate average status event level of all service inventory tagged with Monitored Services for the Enterprise Service name0% to 100%.
- Monitored Service State: If any Monitored Service is marked Down, then the Enterprise then the Service State is marked Unreachable Down, otherwise it is Normal.
Overall Status: The Overall Status can be
overall state
,Status colour Green title Up
, orStatus subtle true colour Yellow title Degraded Status colour Red title Down
TheOverall Status of the Enterprise Service is calculated from the worst
state of eachof the
services.
...
Node State, Interface State and Service State.
Node State Interface State Service State Overall Status Down Down Down Down Degraded Degraded Degraded Normal Normal Normal Up
...
Enterprise Service Rules
Enterprise Service rules calculate how each group of entities control the status of the Enterprise Service. The Enterprise Service rules are defined in /usr/local/omk/conf/ES_Rules.json
The rules set out levels on how each component should be degraded, based on the status level. It is set as an array of Level Type and Level.
...
You can use this to tune the alerts. For example, you can configure a proactive enterprise alert for any service if any Level Type is not Normal.
Enabling Enterprise Services
To enable Enterprise Services –
Add the following code to opcommon.json
| Code Block |
|---|
"beta":{
"opcharts_enterprise_services": "true"
}, |
Execute the following commands
| Code Block |
|---|
sudo /usr/local/omk/bin/patch_config.exe /usr/local/omk/conf/opCommon.json /beta/opcharts_enterprise_services=true |
Restart the omkd daemon
| Code Block |
|---|
sudo service omkd restart |
Adding Status Panels/Tables
After creating a new Enterprise Service on the opCharts, you can add Interfaces, Nodes and Monitored Services status panels/tables to it. At the top of the Enterprise Service page you will see a row of buttons for each option:

Click on one of the options, and the page for that option will load. You can navigate to the add/edit page by clicking on the edit button - for example, below indicates the Nodes page and the 'Edit Nodes' button:

Click the '+' icon to add a Node

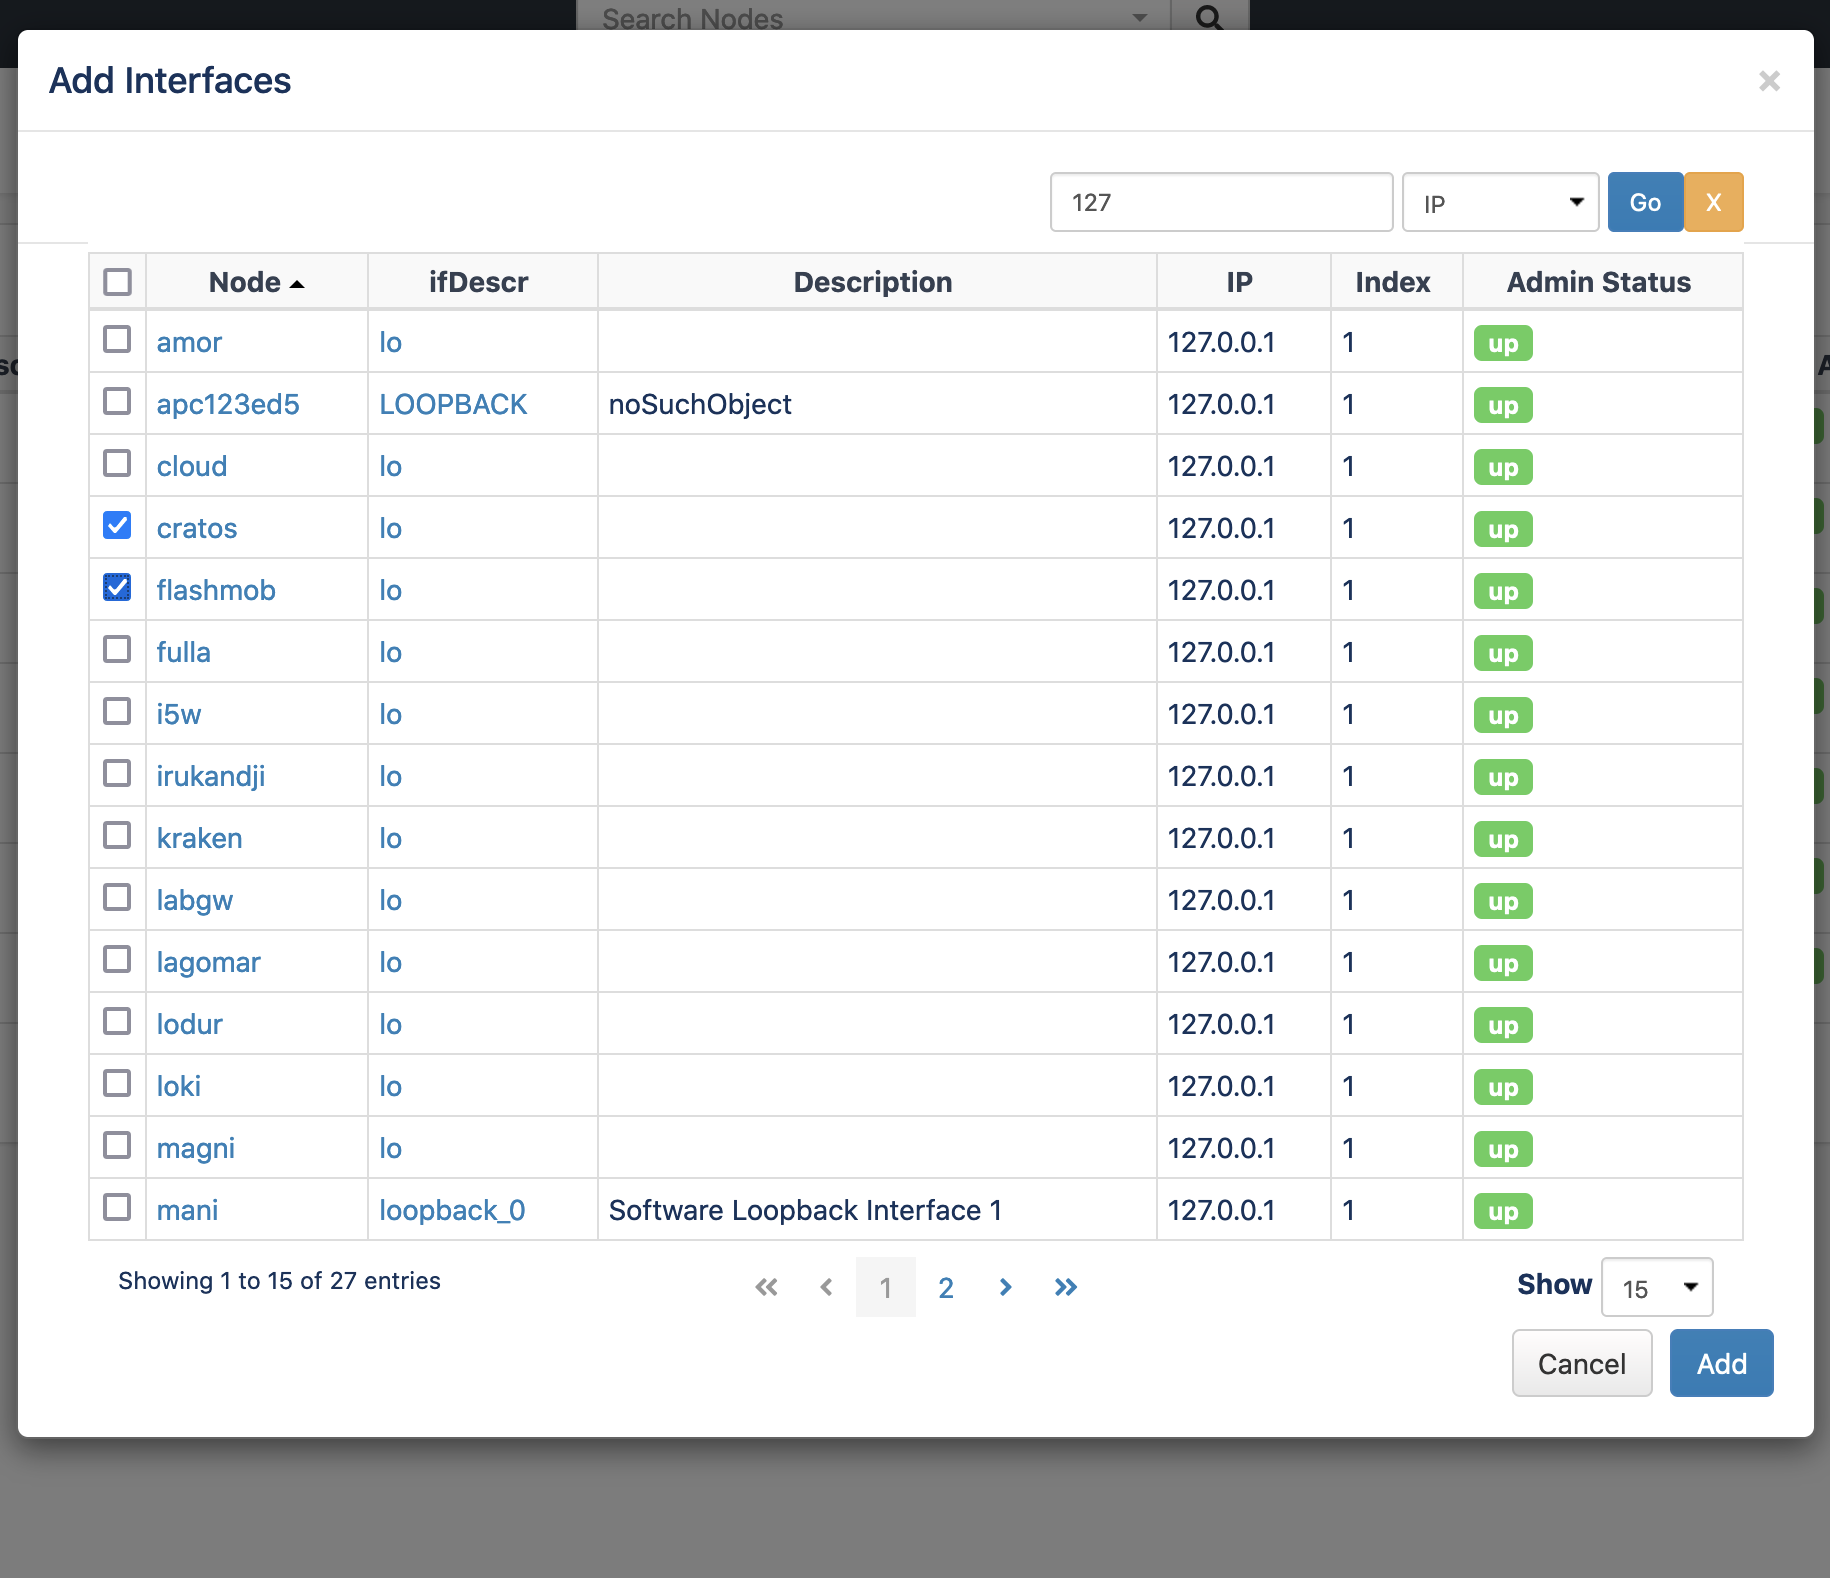
Add an Interface
To add a new interface, press the "+" icon in the Interfaces section as shown in the screen shot above. Enter or select the node name, select the interface index/name and press "Add".
Add a Node
Adding a Node is similar, press the "+" icon in the Nodes section. Enter the node name and press the "Add" button, a node panel for the selected node should now be displayed.

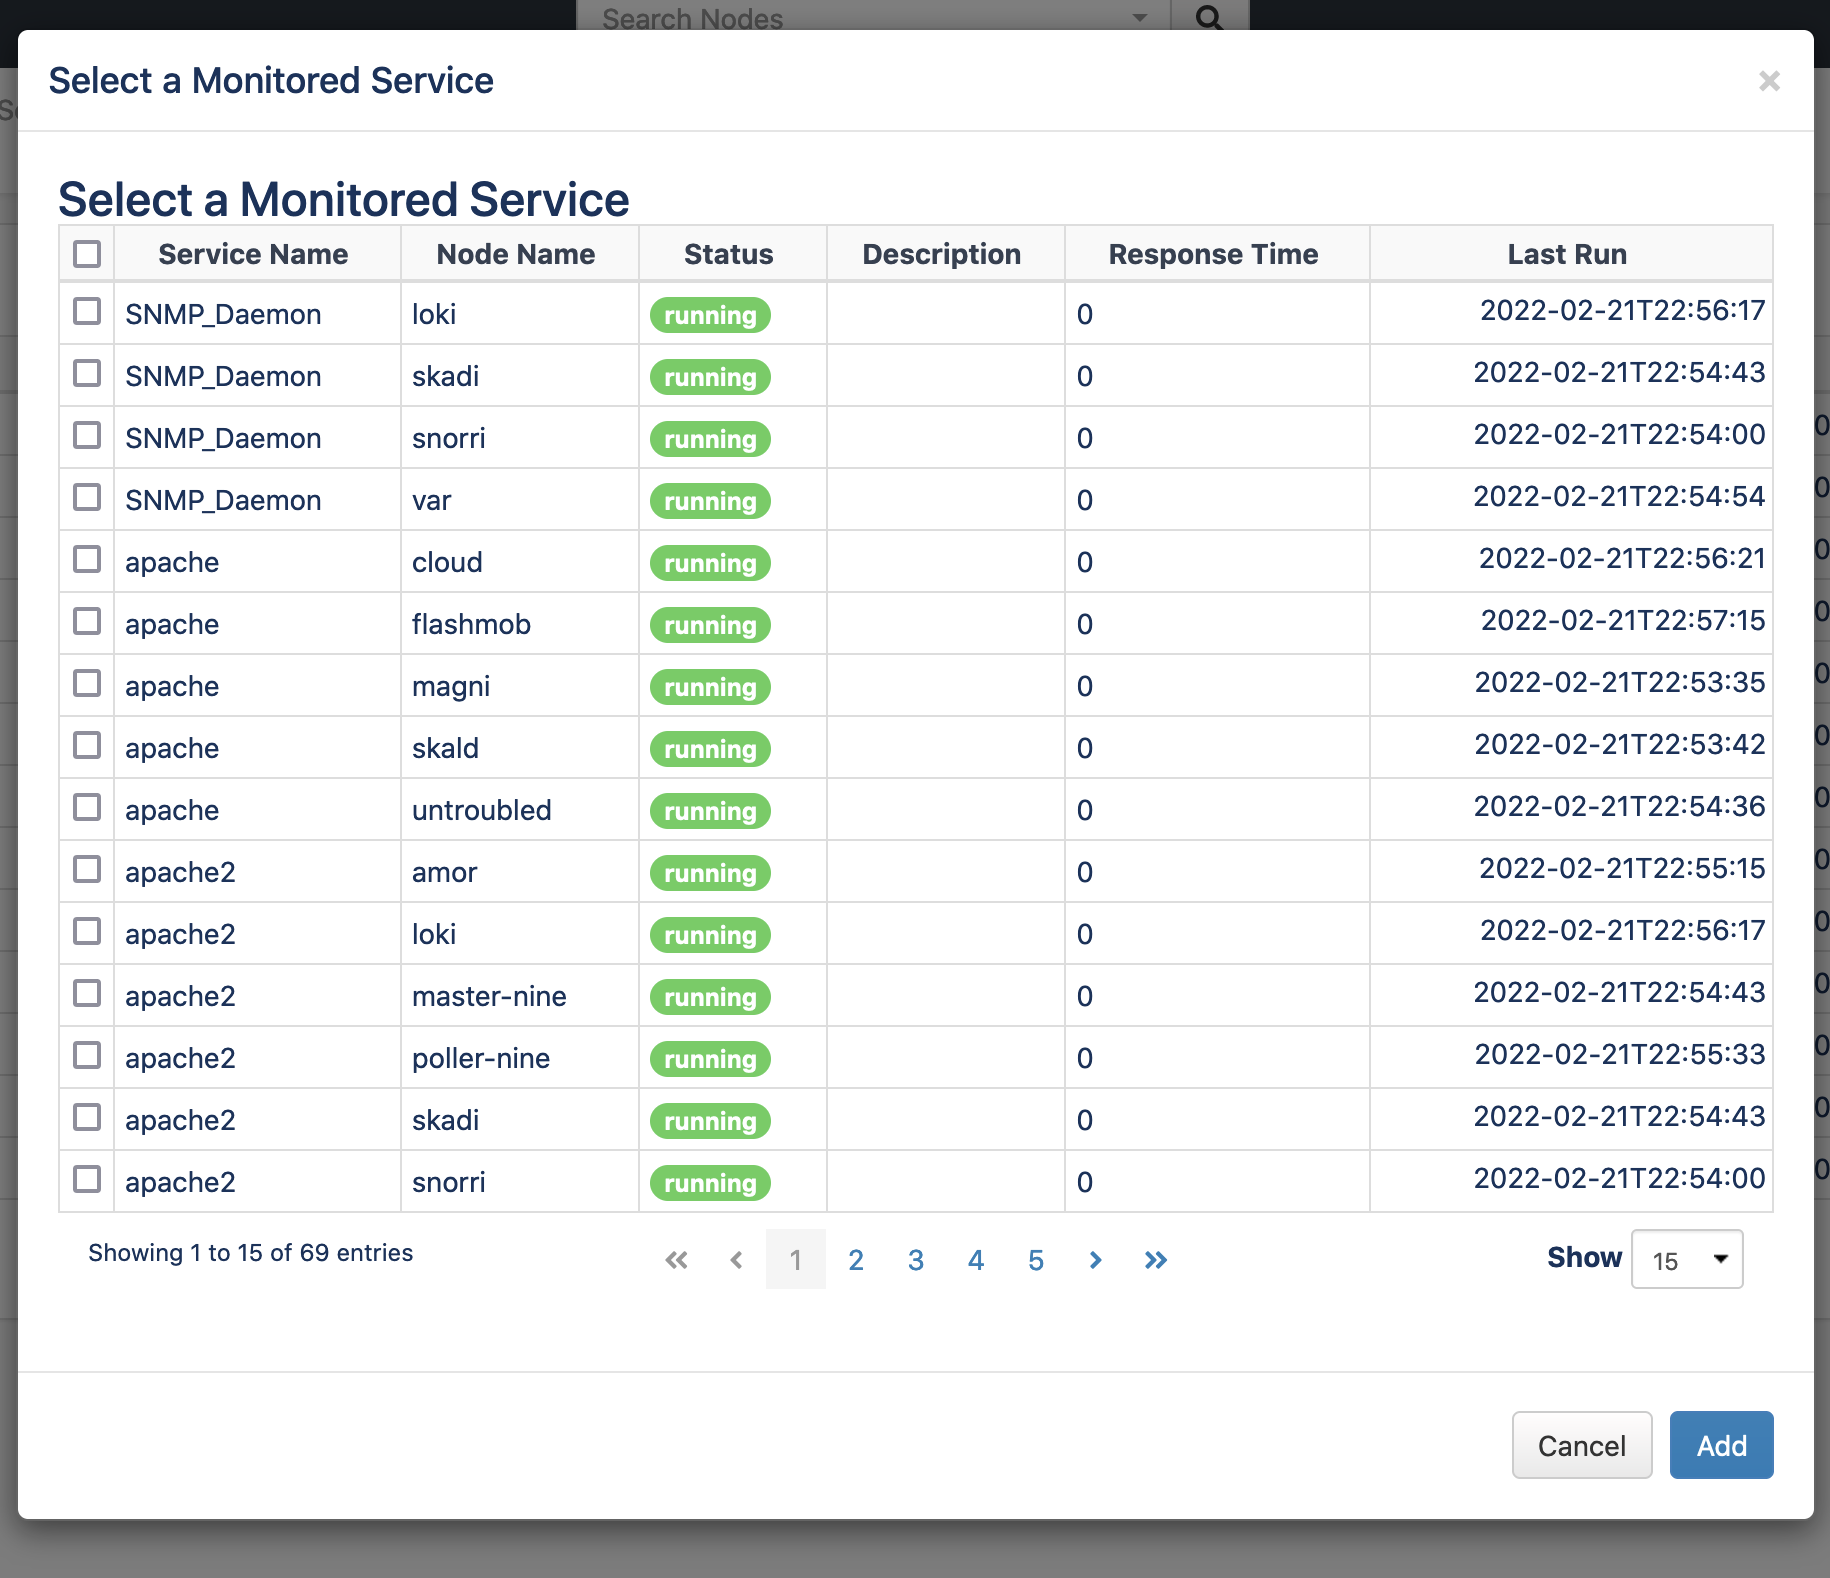
Add a Monitored Service
Remove an Interface, Node or Service
To remove either, press the "x" icon near the top right of the panel and it will be removed from the document. Save the document to accept your changes.
Repair RBAC for an Enterprise Service
We changed how an Enterprise Service is referenced in the database with opCharts-4.5.0 and this causes issues with RBAC (portal users) for Enterprise Services created before 4.5.0.
Easy method, delete the Enterprise Service and recreate with the same name, the nodes, interfaces andservices and services will still be attached to the Enterprise Service.
...