...
The following changes can be made in the opCommon config configuration file /usr/local/omk/conf/opCommon.nmis
...
The graph that show flows over time can display 2 modes: the default shows the number of octets/packets in the current time slice, the second mode makes the graph display the data in octets/second or packets/second. To enable the second mode change the following config variable to 1:
| Code Block | ||
|---|---|---|
| ||
'opflow_gui_graph_over_time_per_sec' => 1 |
opFlowSP 1.0.9 introduced 3 new configuration items:
| Code Block | ||
|---|---|---|
| ||
'opflow_gui_hide_interface_performance_graphs' => 0, # Custom agent button #'opflow_gui_agent_custom_button_text' => 'Button Text', #'opflow_gui_agent_custom_button_url' =>'https://example.com/omk/opCharts/inventory/interfaces', |
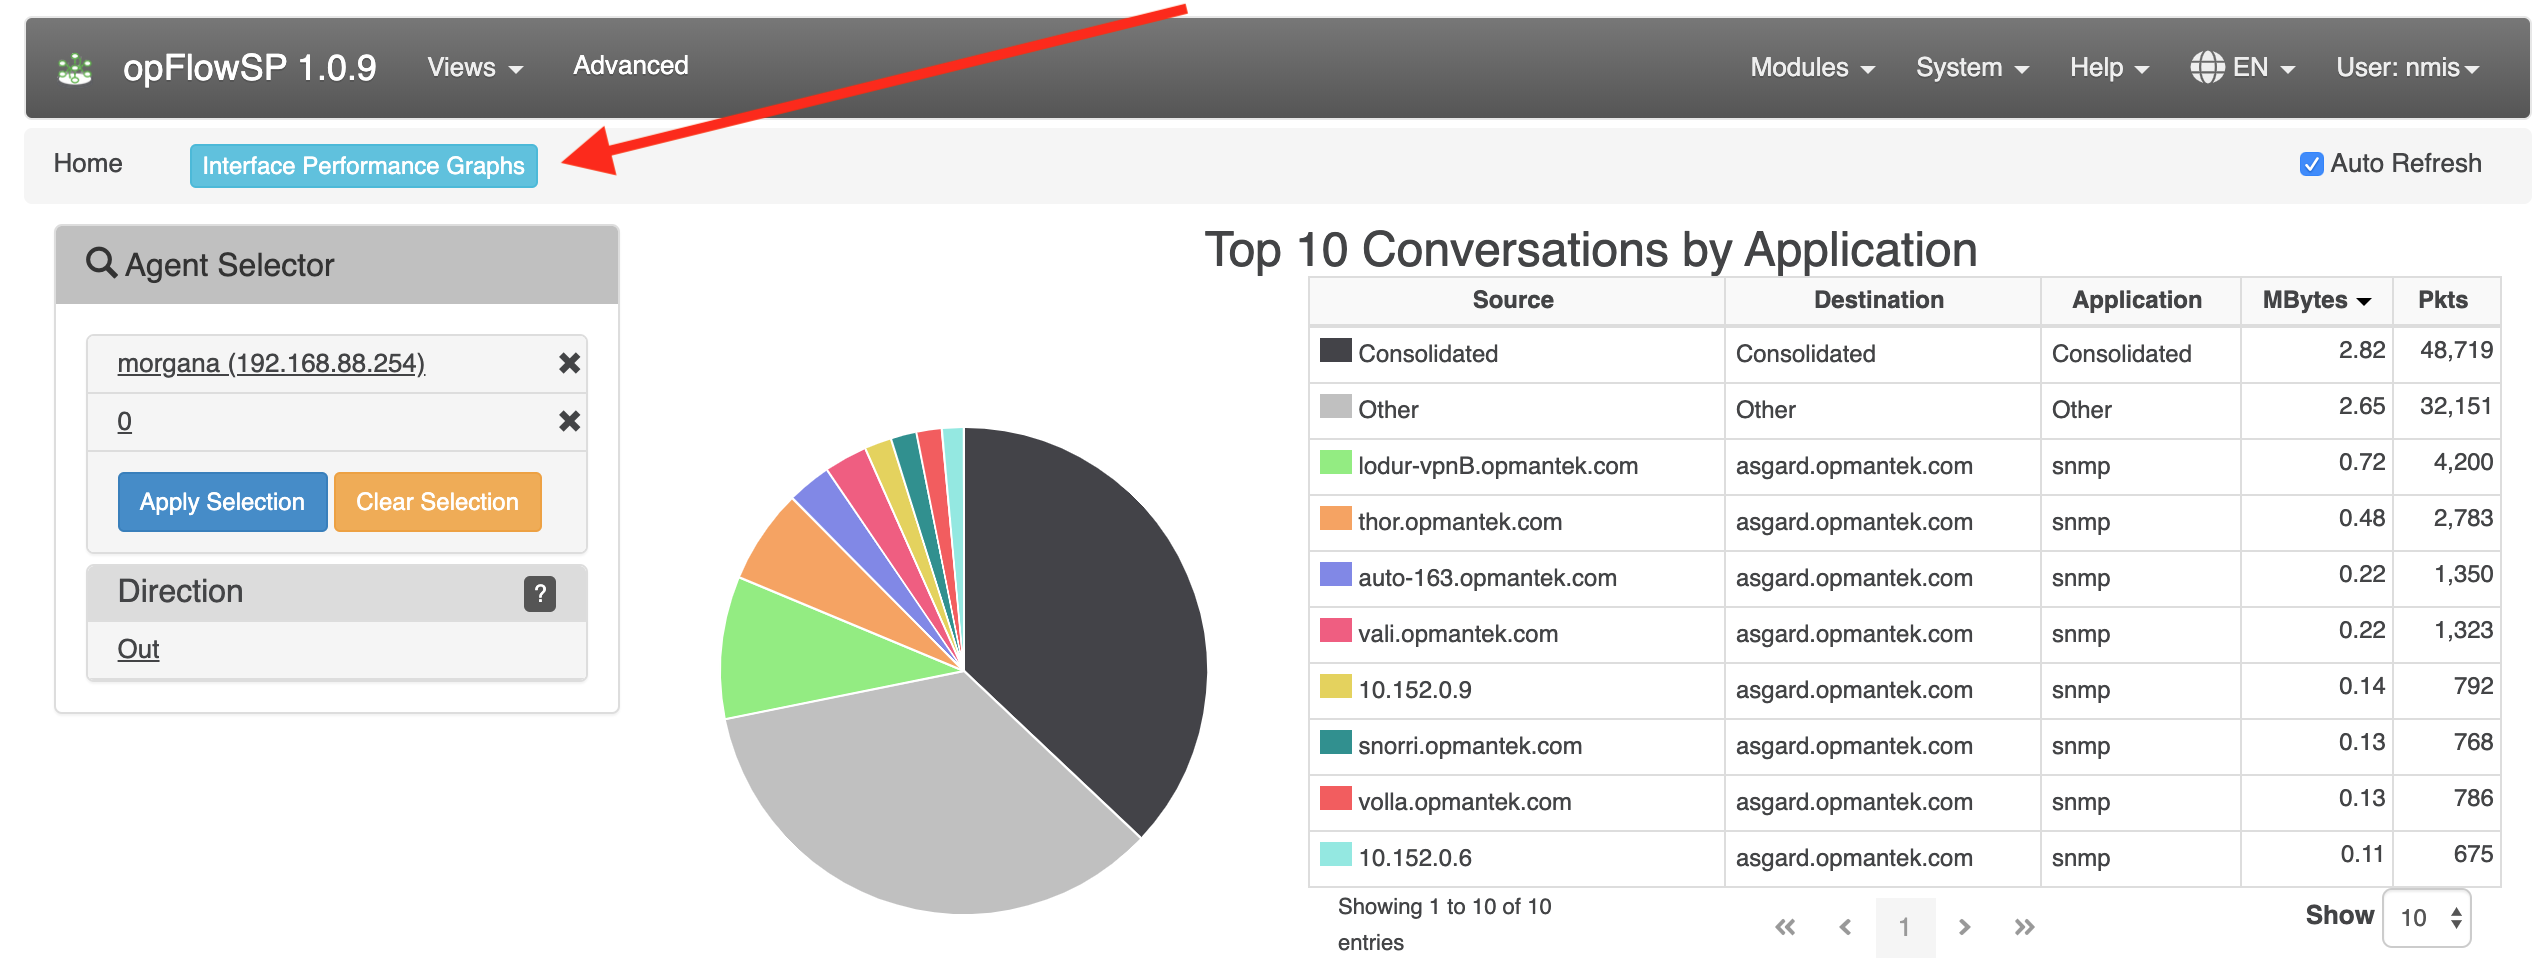
opflow_gui_hide_interface_performance_graphs is used to hide or show the button "Interface Performance Graphs". Default is 0 to show the button. Set to 1 to hide the button.
opflow_gui_agent_custom_button_text and opflow_gui_agent_custom_button_url are set together to add a button with a custom link to be visible to the right of "Interface Performance Graphs".
Possibility to set the octet format to MegaBytes (MB) or Megabits (Mbits) using the configuration item opflow_gui_octet_display_multiplier.
| Code Block | ||
|---|---|---|
| ||
    'opflow_gui_octet_display_multiplier' => 0.000000953674316,
'opflow_gui_octet_display_multiplier' => 0.000008, |
Restart the daemons
After making changes to the config make sure to restart all opFlow daemons.
...