...
Forewarned is forearmed the poverb proverb goes, a quick google tells me "prior knowledge of possible dangers or problems gives one a tactical advantage". The reason we want to baseline and threshold our data is so that we can receive alerts forewarning us of issues in our environment, so that we can act to resolve smaller issues before they become bigger. Being proactive increases our Mean Time Between Failure.
...
In practicality this spike was brief and using the 15 minute threshold period (current is the average of the last 15 minutes) the value for calculating change would be 136 and the resulting change would be 36% so a Major event. The threshold period is dampening the spikes to remove brief changes and allow you to see changes which last longer.
Installing the Baseline Tool
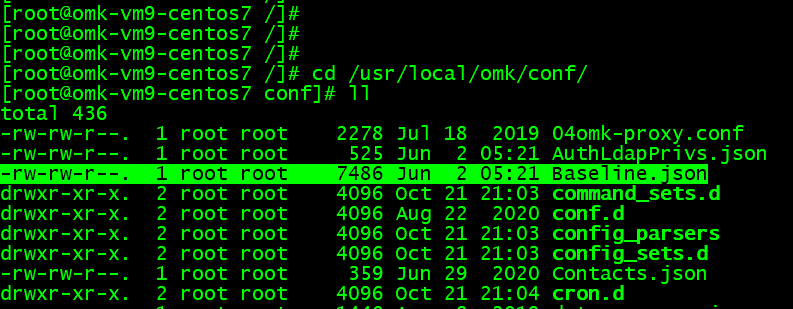
Copy the file to the server and do the following, upgrading will be the same process.
...
Flatline Baseline
Supported from opCharts 3.6.1.
When a metric remains to the same level for an extended period, it is called a flatline detection. This means, the standard deviation is 0.
- 'threshold_period' => "-60 minutes" # Default -15 min
- 'threshold_std_deviation' => 0.001, # Or 0. It checks the standard deviation (stddev)
- 'threshold_exceeds' => 2, # Or ignored. If not set, it will create an event every time it detects a flatline.
- 'threshold_level' => 'critical' # Or Major by default
Flatline example:

The first flatline would be detected just when threshold_std_deviation is 10 in the example.
Flatline example with threshold exceed:
Example:
| Code Block |
|---|
'ifInErrors' => {
    'baseline' => 'flatline',
    'active' => 'true',
    'metric' => 'ifInErrors',
    'type' => 'pkts_hc',
    'nodeModel' => 'CiscoRouter|CatalystIOS|CiscoNXOS',
    'use_index' => 'interface',
    'event' => 'Proactive Output Discards (flatline)',
    'indexed' => 'true',
    'threshold_std_deviation' => 0.001,
    'threshold_period' => "-60 minutes",
    'threshold_exceeds' => "20"
}, |
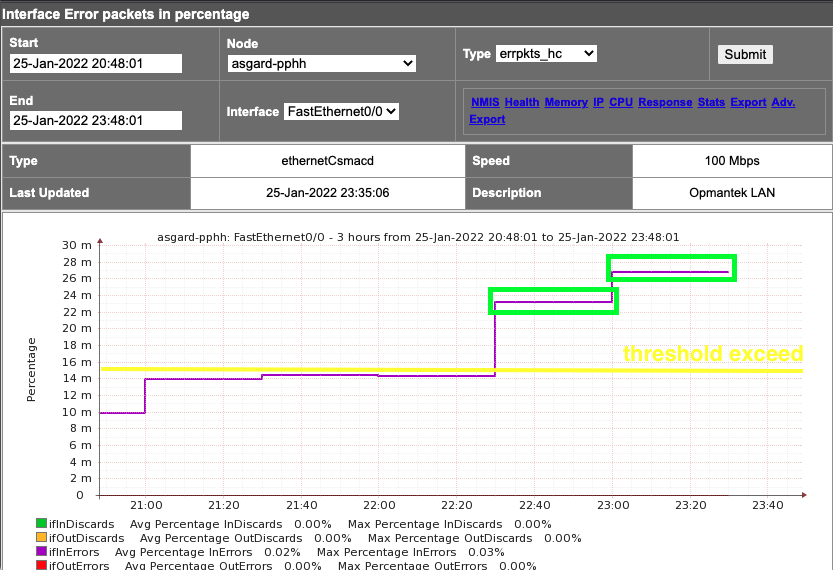
Simple Baseline
The simple baseline just detects when the average of a selected period raises a threshold level.
- threshold_period
- levels
Example:

Example:
| Code Block |
|---|
  'ifInErrors' => {
    'baseline' => 'simplethreshold',
    'active' => 'true',
    'metric' => 'ifInErrors',
    'type' => 'pkts_hc',
    'nodeModel' => 'CiscoRouter|CatalystIOS|CiscoNXOS',
    'use_index' => 'interface',
    'event' => 'Proactive Output Discards (simplethreshold)',
    'indexed' => 'true',
    'threshold_period' => "-120 minutes",
    'levels' => {
      'Warning' => 10,
      'Minor' => 20,
      'Major' => 30,
      'Critical' => 40,
      'Fatal' => 50
    }
}, |
In the above graph, that would be a Fatal alert.
Installing the Baseline Tool
The baseline tool is installed with recent versions of opCharts.
Working with the Dynamic Baseline and Thresholding Tool
...
| Code Block |
|---|
# run the baseline every 5 minutes starting at 3 and 4 minutes offset from the hour. 3-58/5 * * * * root /usr/local/omk/bin/baseline.exe act=run group_regex="Core|Dist" > /usr/local/omk/log/baseline1.log 2>&1 4-59/5 * * * * root /usr/local/omk/bin/baseline.exe act=run group_regex="Access" > /usr/local/omk/log/baseline2.log 2>&1 |