...
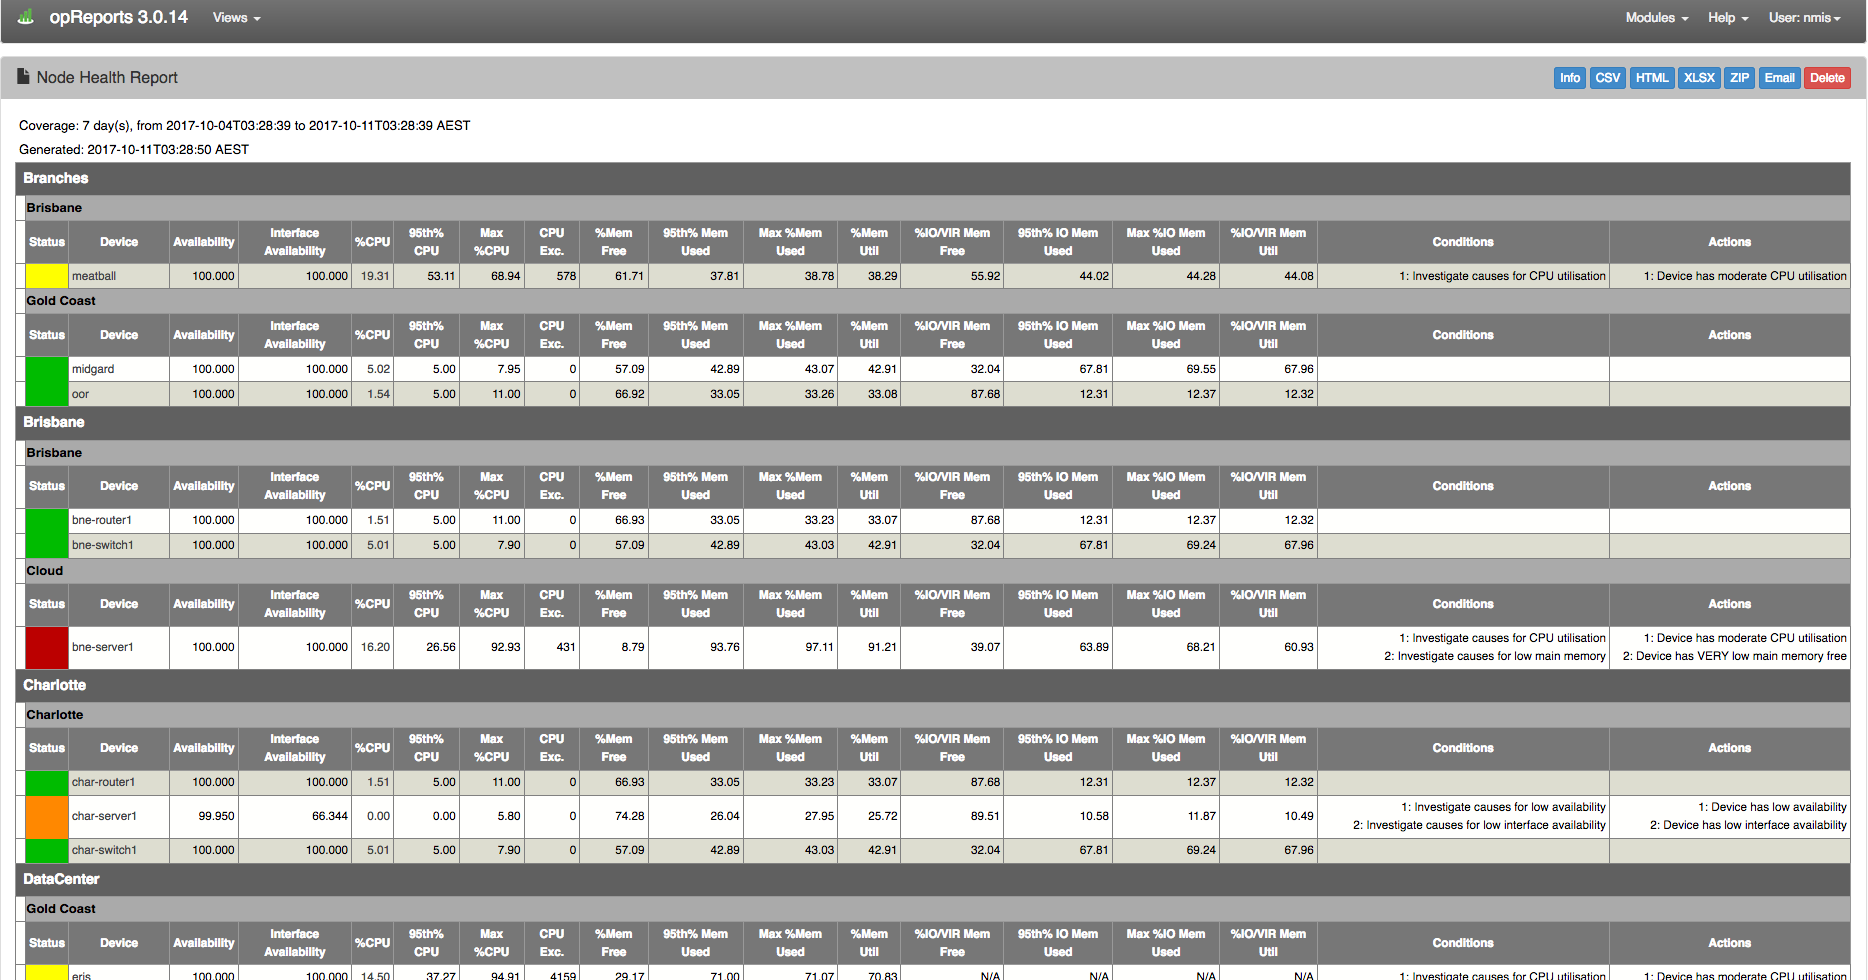
The Node Health report display health-related attributes for all selected nodes for a given period. Attributes displayed are: Status, Device, Availability, Interface Availability, %CPU, 95th% CPU, Max %CPU, CPU Exc., %Mem Free, 95th% Mem Used, Max %Mem Used, %Mem Util, %IO/VIR Mem Free, 95th% IO Mem Used, Max %IO Mem Used, %IO/VIR Mem Util. As of version 3.1.4 when this report is exported to XLSX and CSV formats the following columns of information are also displayed: Group, %IO Mem Free.
The report also includes two columns with the detected (abnormal) Conditions and the recommended Actions.
...
Below shows the outcome of a default Node Health Report or where exceptions=false. The full report can be viewed by downloading the ZIP file Here HERE

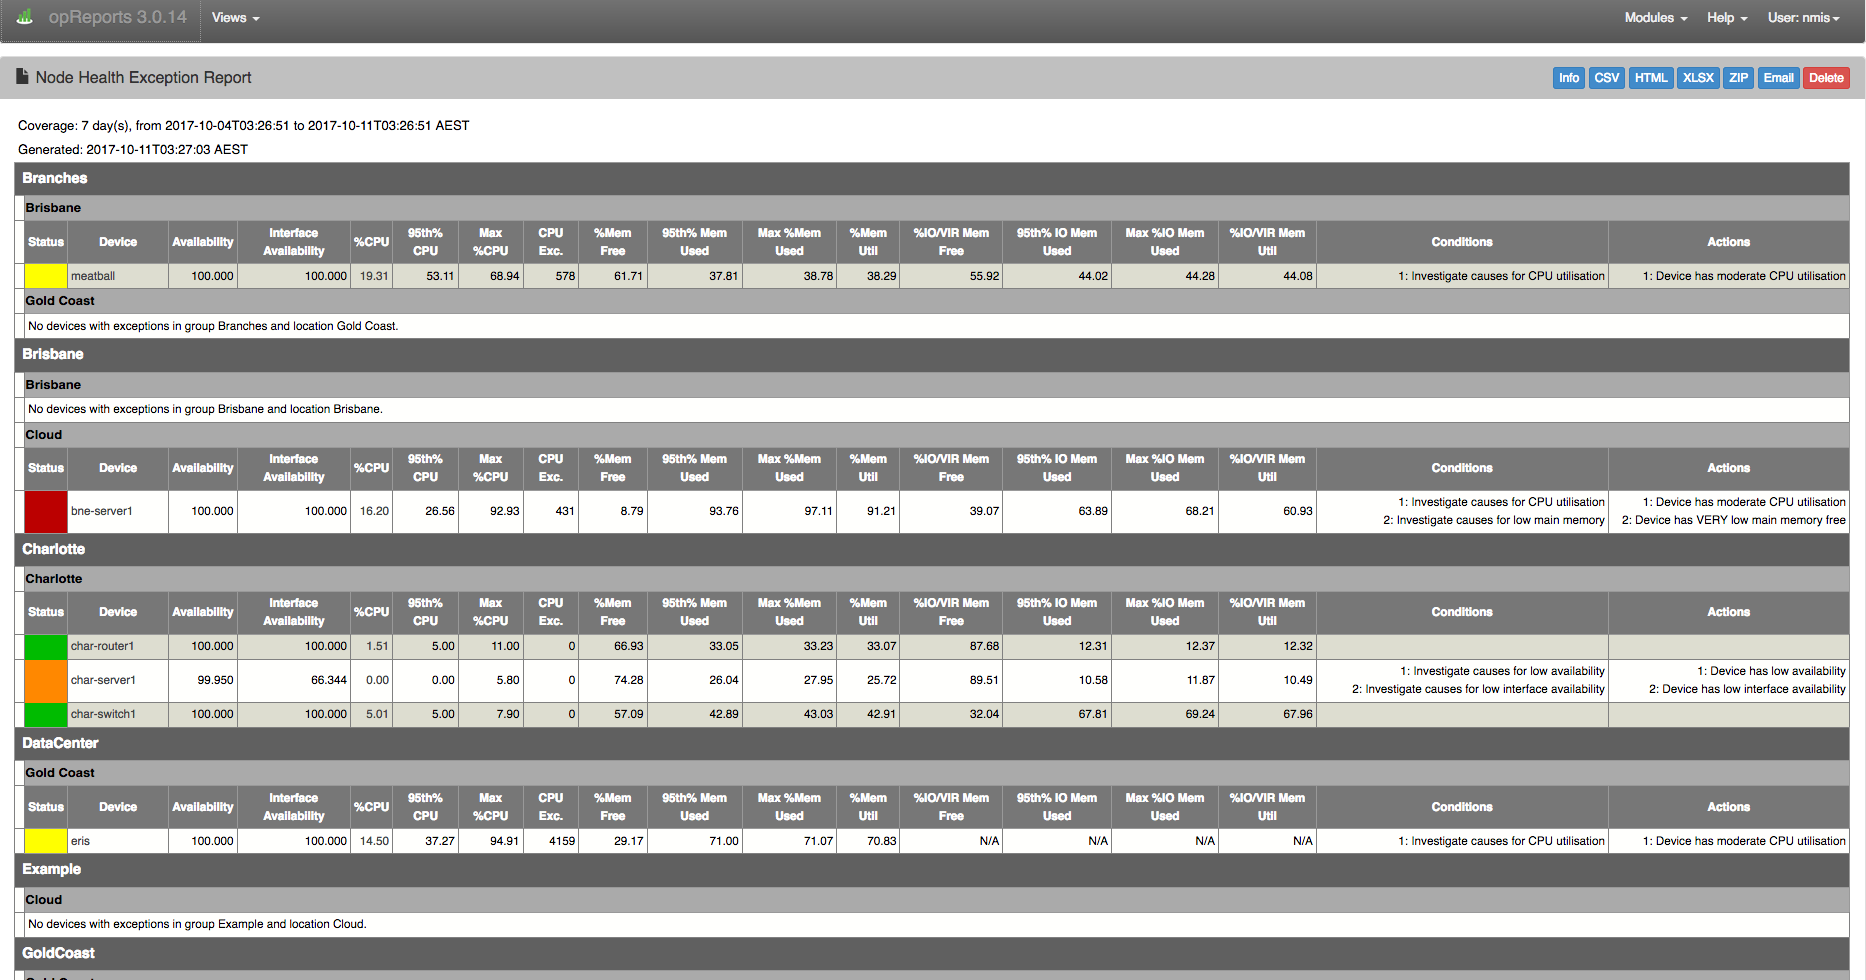
To create a Node Health Report showing exceptions only, select click the box that the arrow points to in the image below.
...
A Node Health Report using the same devices where exceptions=true looks similar to the image below. The full report can be viewed by downloading the ZIP file Here HERE

The formulas used for calculation of the reporting conditions can be tuned and adjusted by the user:
...