...
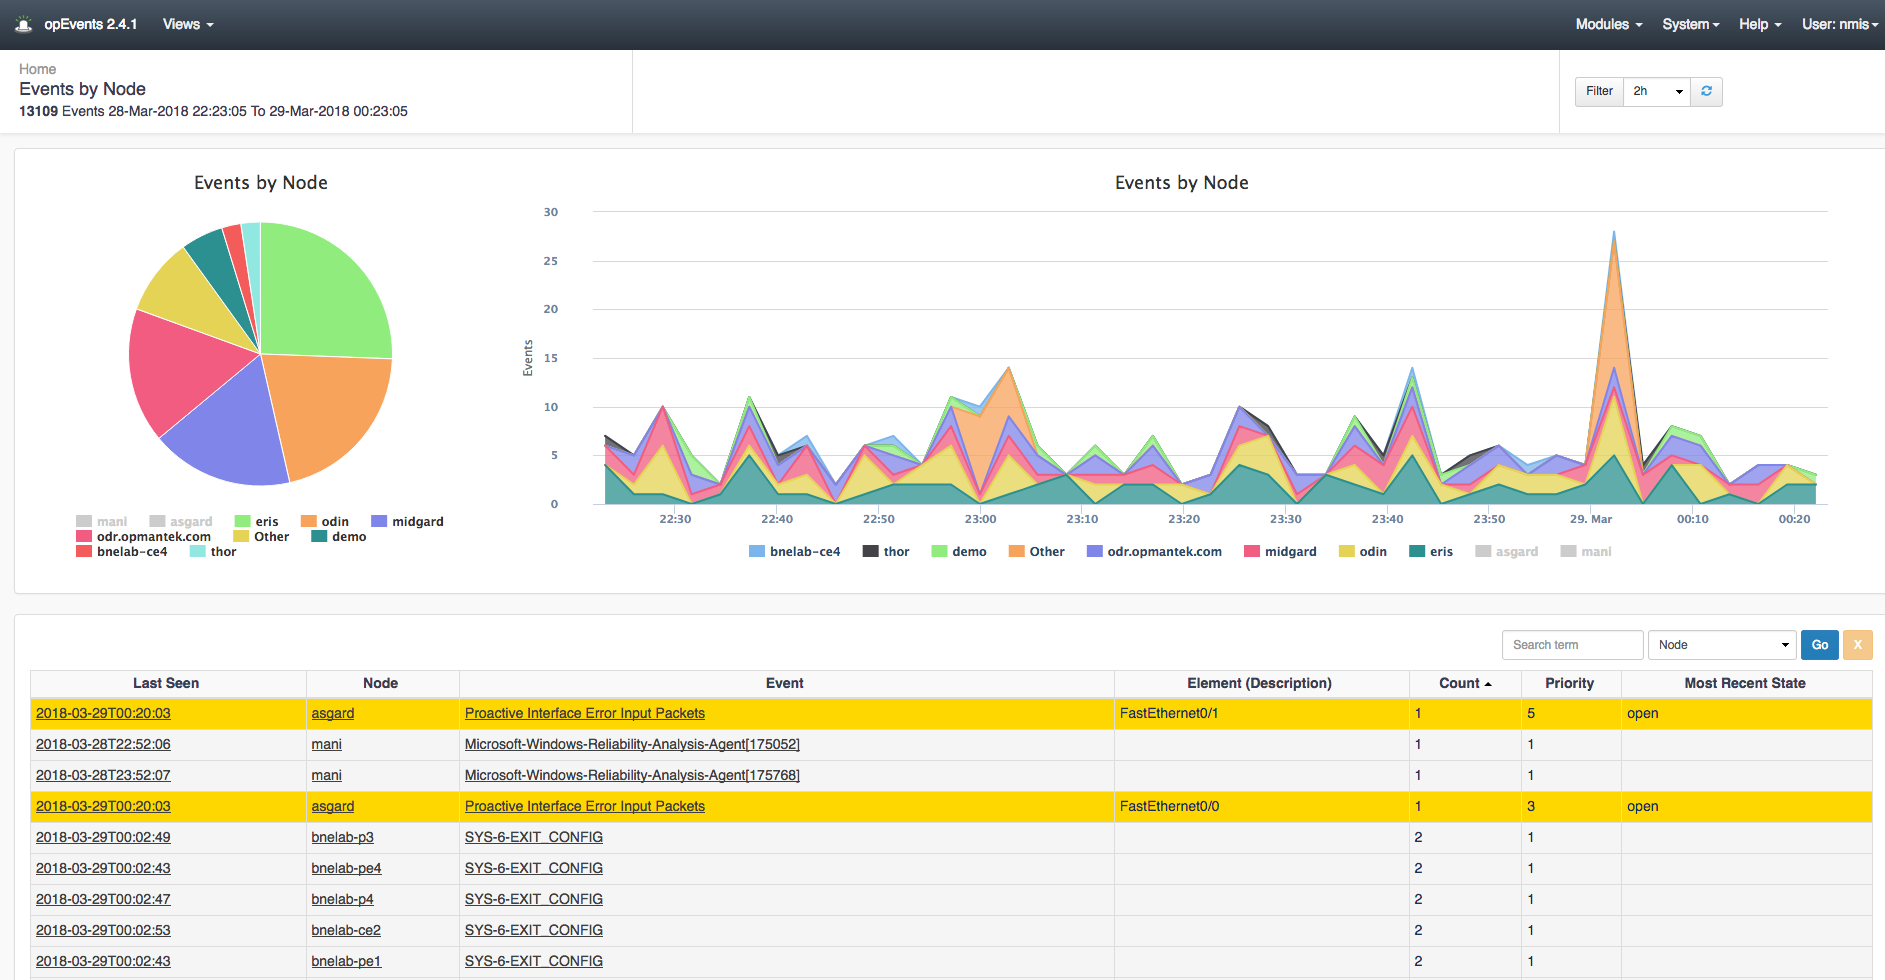
The default view in opEvents shows the Dashboard which displays the Events by Node. From this page you can visually see which devices are generating the most events.
Clicking on the pie chart or the graph to the right of it allows you to drill into the events of a specific device or the list of events that occurred in specific time periods. Clicking on the device name at the bottom of the Events by Node charts allows you to filter out devices you do not want to display on the charts granting you the ability to customize your charts view.
In the table below the two charts you can see the time of the event, the node, the event name, description of the event, the amount of times this event occurred, the priority, and the most recent state of the node. These can be sorted by event count, priority, event name, or which ever makes finding relevant events easier. The table also has a search field located above the count column making finding specific events quickly.
With the time filter located in the top right of the chart you can filter the time period to view events generated during certain time windows.
On any of these the pages in the menu -> Views drop down menu you can click on the event Name, Node, Last Seen, Title, etc. and drill into more granular details. In the example below I am clicking the link to the device "asgard" which opens up the "Node Context" page.
If you click on an event an "Event Context" page would open giving you more granular details about the specific event as well. As you can see there is much more useful and specific information provided from this page.
Using the example below, there are six menu options at the top: Details, View Node in NMIS, Show Address Configuration, Show Node Performance, Show Node Configuration, and More.
Clicking the "Details" menu item displays the complete raw details for the specific node or event.
Clicking on "View Node in NMIS" opens up an NMIS Node Details menu.
Clicking the "Show Address Configuration" will open up our opAddress module that gives information on the ip addresses for this device.
"Show Node Performance" will open the device information screen in our opCharts module.
Clicking on "Show Node Configurations" will open our opConfig module displaying recent commands and configuration changes, etc. for the device.
The "More" drop down menu gives you the ability to edit the node or view more events if you happen to be viewing an Event Context page.
...
Other information provided on this screen is a Node Summary, Recent events for this device, Elements Up, and Elements Down. Clicking on the icons in the Elements Up and Down menus, clicking the Event Up and Event Down icons buttons will open the Event Context page for that event. Clicking the Edit State icons you can either Toggle the State Up or Down, or Remove the State.
Notice in the image above in the Recent Events for asgard section there is some blue text indicating that there are too many events for the table. If you click on this link it will open the Events view for this Node displaying all of the nodes events on one page. In this same section there is a blue "Overview" menu item, clicking button. Clicking on this will open the Node Events Overview page for this device. This page is similar to the default Dashboard page however, it is only displaying the events for this particular device. Same as the Dashboard page you can filter the time you want to view Events, filter events displayed on the charts, search for Events, and drill into each Event by clicking the Event link in the table below.
...
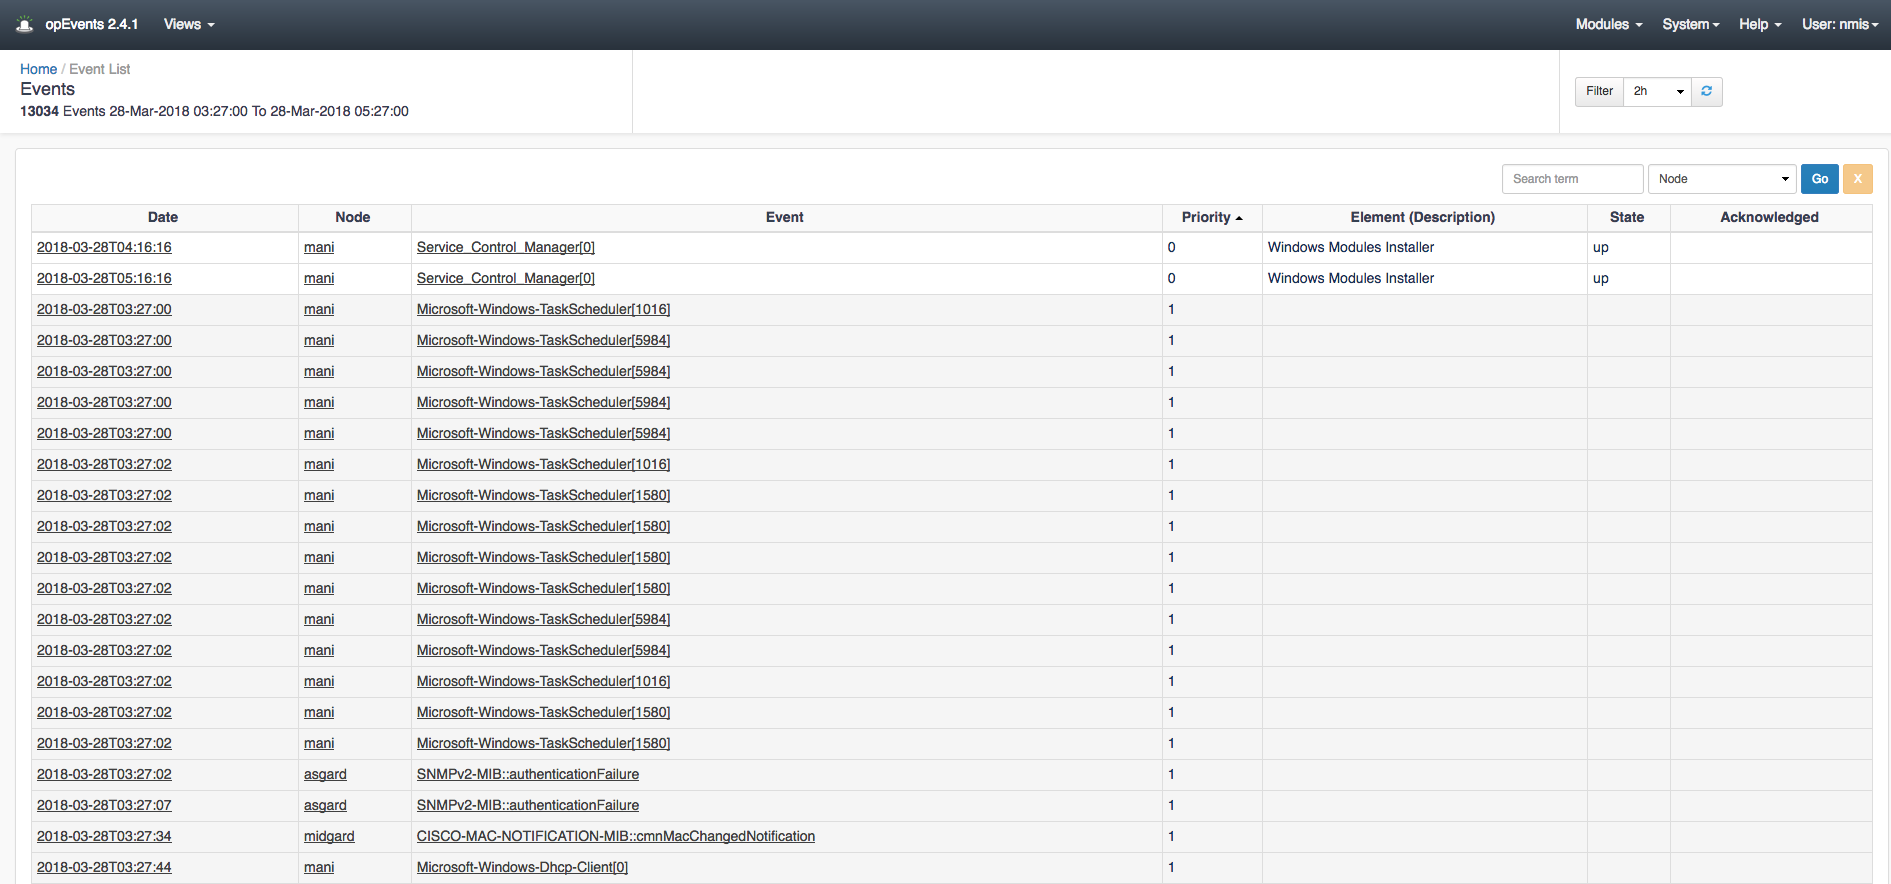
Navigating to menu Views -> Events you can see a bit more detailed view of the table on the Dashboards page. Notice above the table in the top left displays the total number of events along with the date and time period reported on. With added editions of the State and Acknowledged columns you see which events need action and which have already been acknowledged by another member of your team. This page has the search box and time filter options as well.
If desired, you can change the page to display more than 25 events at a time by scrolling to the bottom of the page and selecting the drop down Show menu item. Each Date, Node, and Event are clickable and open up a more detailed view of them. To the left of the Show menu item is a button which allows for this page to be exported to CSV granting you and your team the ability to share a detailed report of the events across your devices.
Each Date, Node, and Event are clickable and open up a more detailed view of them.
Current Events View
In this view you can Acknowledge events that have recently occurred and may not have been looked at yet. It allows for quick event acknowledgement by the bulk acknowledge feature which is accomplished by clicking the boxes next to each event then clicking the blue Acknowledge button. You can also acknowledge all of the events on this page at one time by clicking the box in the top left of the table which selects all of the events.
As in the previous views you may show more than 10 events on the page as well as search for events and filter the time period shown. As in the other Views, each Date, Node, and Event are clickable links allowing you to drill deeper into them for more information.
...
The actions view located at menu -> Views -> Actions displays the actions that have been taken for any given event. Event actions are the conditions an event must conform to and what actions to take in case of a match.
The event Date, Name, Node, Action, Details, and Comment section is displayed on the table. These The items on the table can be customized to your liking by adding or taking away information displayed on this the page. These changes can be made by navigating to /usr/local/omk/conf/table_schemas (on the servers' filesystem) and editing the opEvents_action-log.json file. We have a Wiki page written up on how to edit these values here: opEvents 2.4.x - Customising Customizing Table Columns.
You can sort these events clicking each Table header and click their links as well for detailed information.
Similar to the Events view you can download it as a CSV and choose to display more events on the page from the Show drop down menu. The table can be customized to display more or less information
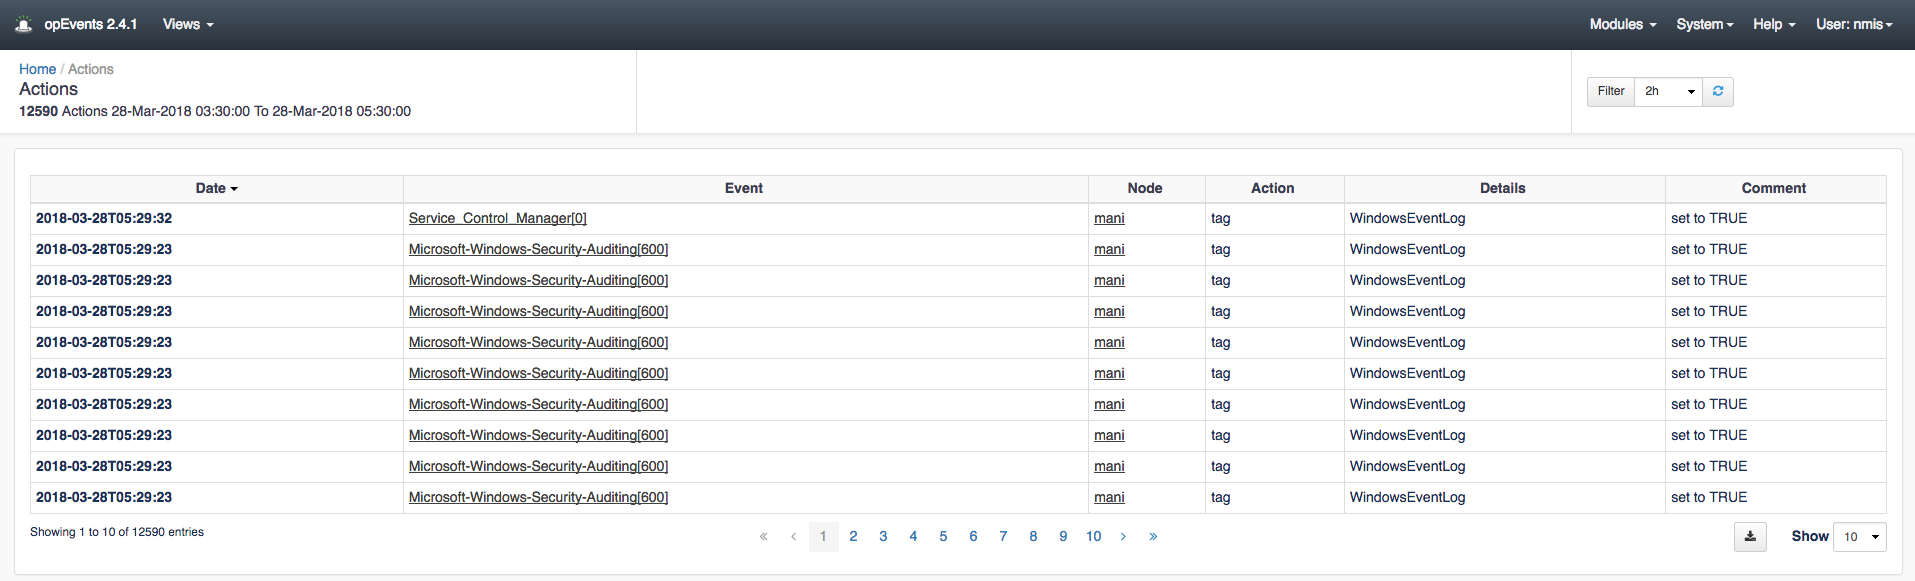
For example, the image below shows the default menu bar for the Actions view in opEvents.
...
After editing the opEvents_action-log.json file the extra column was added to the end of the row labeled "New Custom Column". This process can be replicated to display custom information in as many columns as you would like on this page.

More detail on what which Actions can be managed can be found here: Event Actions and Escalation (opEvents 4)
Raw Logs View
The Raw Logs view displays the current raw event logs. This view is useful for viewing what the full event message says within the Entry column. Clicking the Event ID link will open up the Event Details page for the chosen event.
As with other views, you can export this information to CSV by clicking the Export to CSV button to the left of the Show drop down menu which of course allows for more events to be displayed on the page.
The time filter in the top right of the page will also make viewing specific events quicker.
The These items on the table can be customized to your liking by adding or taking away information displayed on this page. These changes can be made by navigating to /usr/local/omk/conf/table_schemas and editing the opEvents_raw-log.json file. We have a Wiki page written up that goes into more detail on how to edit these values here: opEvents 2.4.x - Customising Table Columns.
...
These items on the table can also be customized to your liking by adding or taking away information displayed on this page. These changes can be made by navigating to /usr/local/omk/conf/table_schemas (on the servers' filesystem) and editing the opEvents_node-log.json. For more information on this process we have documentation that goes into more detail on how to edit these values here: opEvents 2.4.x - Customising Table Columns.
...
The Summary Reports View gives you details on all of the reports generated.
These reports can be downloaded in an XLSX file by clicking the download button in the XLSX column.
The Show drop down menu chooses how many summaries to show on this page. Similar to other pages mentioned above, these items on the table can also be customized to your liking by adding or taking away information displayed on this page. These changes can be made by navigating to /usr/local/omk/conf/table_schemas (on the servers' filesystem) and editing the opEvents_summary-reports.json. For more information on this process we have documentation that goes into more detail on how to edit these values here: opEvents 2.4.x - Customising Table Columns.
...