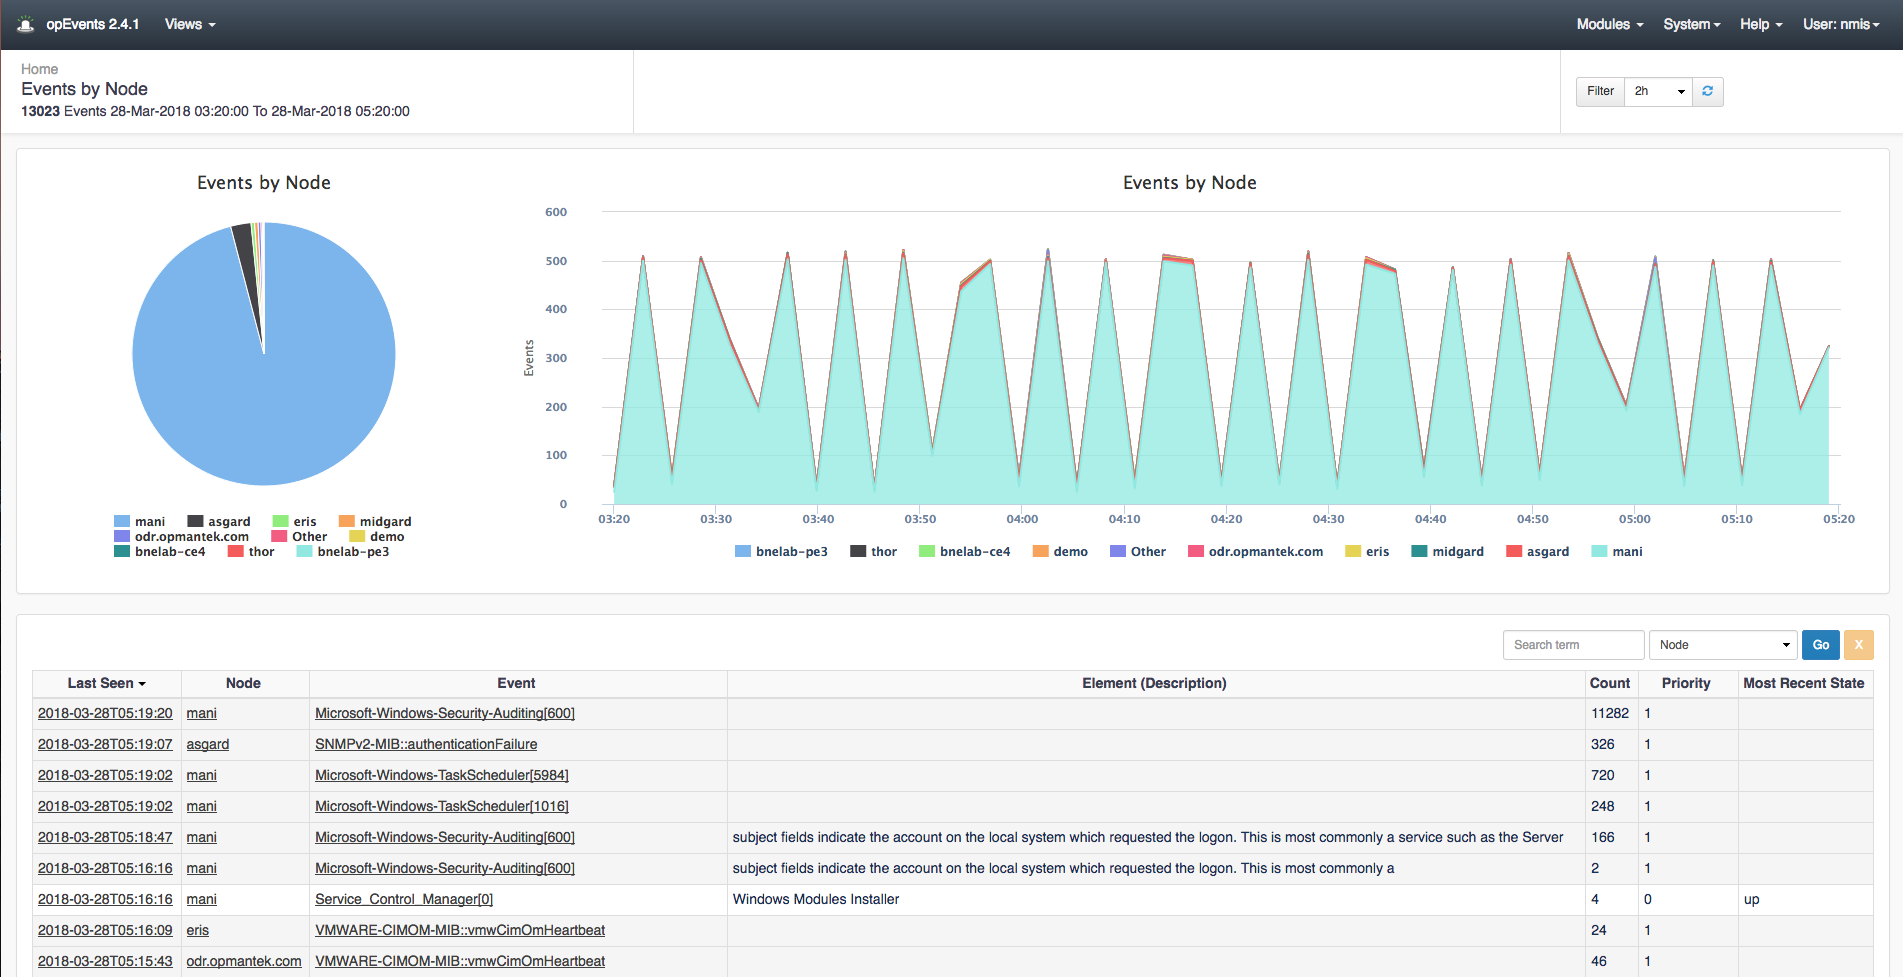
Dashboard view
The default view in opEvents shows the Dashboard which displays the Events by Node. From this page you can visually see which devices are generating the most events. Clicking on the pie chart or the graph to the right of it allows you to drill into the events of a specific device or the list of events that occurred in specific time periods. In the table below the two charts you can see the time of the event, the node, the event name, description of the event, the amount of times this event occurred, the priority, and the most recent state of the node. These can be sorted by event count, priority, event name, or which ever makes finding relevant events easier. The table also has a search field located above the count column making finding specific events quickly. With the time filter located in the top right of the chart you can filter the time period to view events generated during certain time windows.
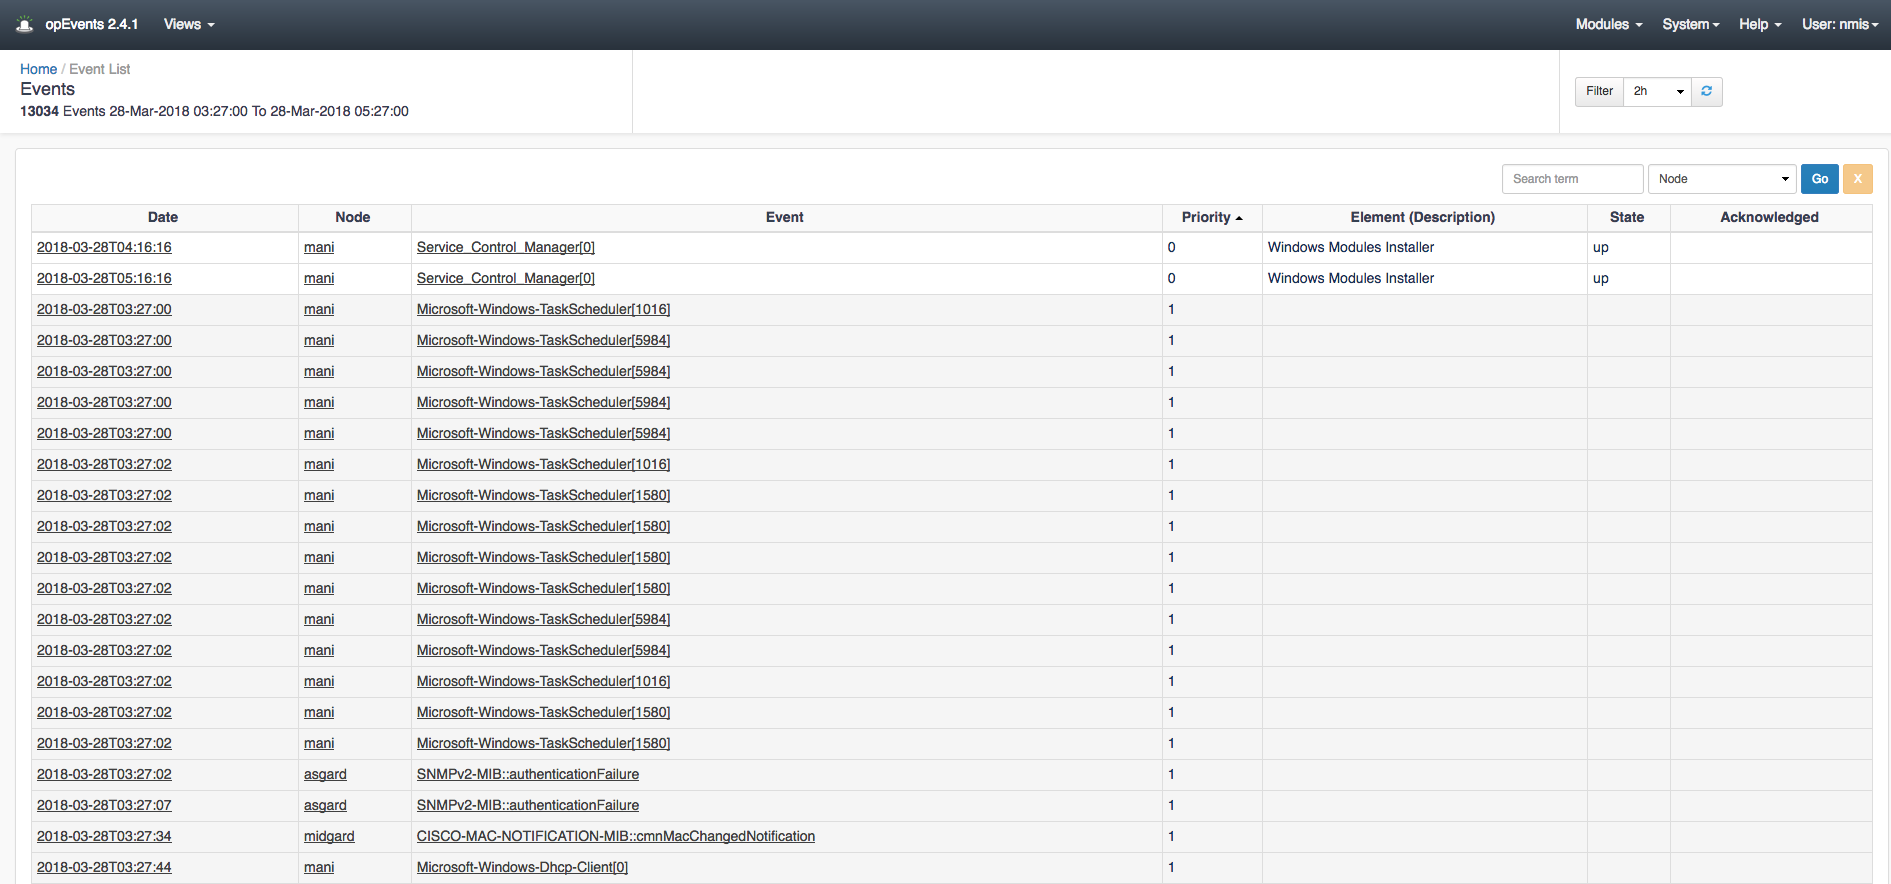
Events view
Navigating to menu Views -> Events you can see a bit more detailed view of the table on the Dashboards page. With added editions of the State and Acknowledged columns lets you see which events need action and which have already been acknowledged by another member of your team.