...
On any of these pages in the menu -> Views drop down menu you can click on the event Name, Node, Last Seen, Title, etc. and drill into more granular details. In the example below I am clicking the link to the device "asgard" which opens up the "Node Context" page. If you click on an event an "Event Context" page would open giving you more granular details about the specific event as well. As you can see there is much more useful and specific information provided from this page. Using the example below, there are six menu options at the top: Details, View Node in NMIS, Show Address Configuration, Show Node Performance, Show Node Configuration, and More. Clicking the "Details" menu item displays the complete raw details for the specific node or event. Clicking on "View Node in NMIS" opens up an NMIS Node Details menu. Clicking the "Show Address Configuration" will open up our opAddress module that gives information on the ip addresses for this device. "Show Node Performance" will open the device information screen in our opCharts module. Clicking on "Show Node Configurations" will open our opConfig module displaying recent commands and configuration changes, etc. for the device. The "More" drop down menu gives you the ability to edit the node or view more events if you happen to be viewing an Event Context page.
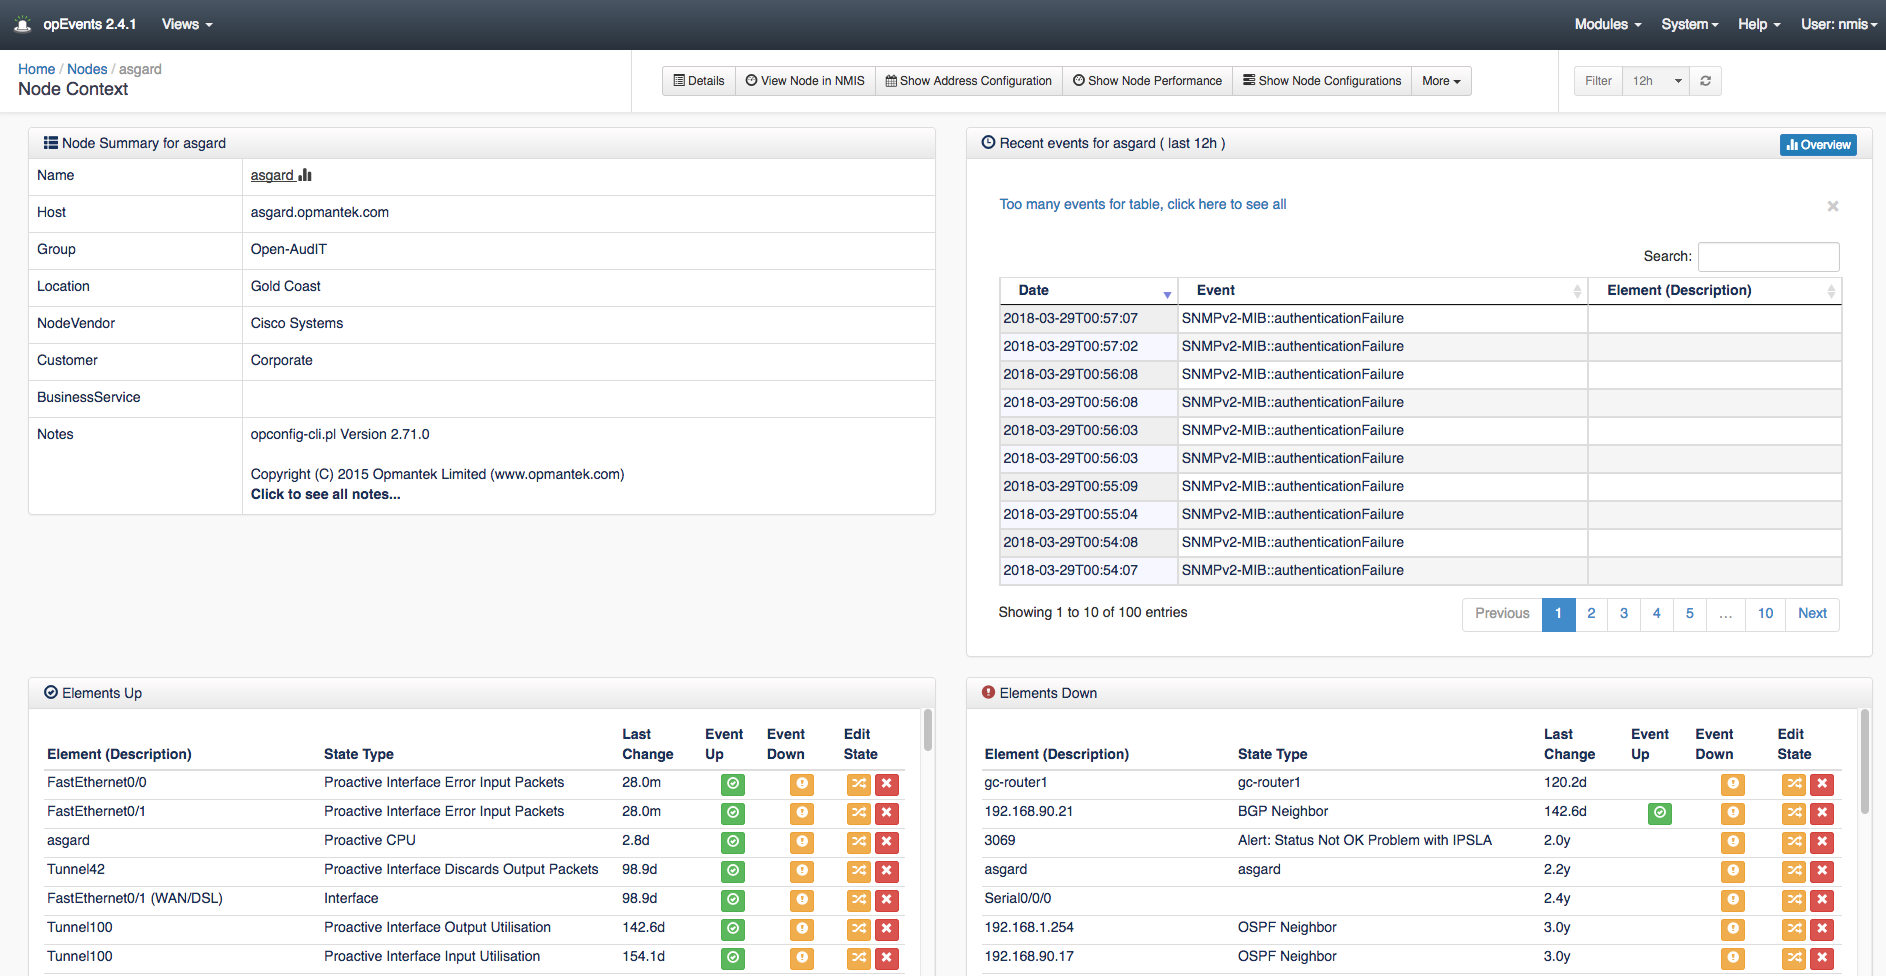
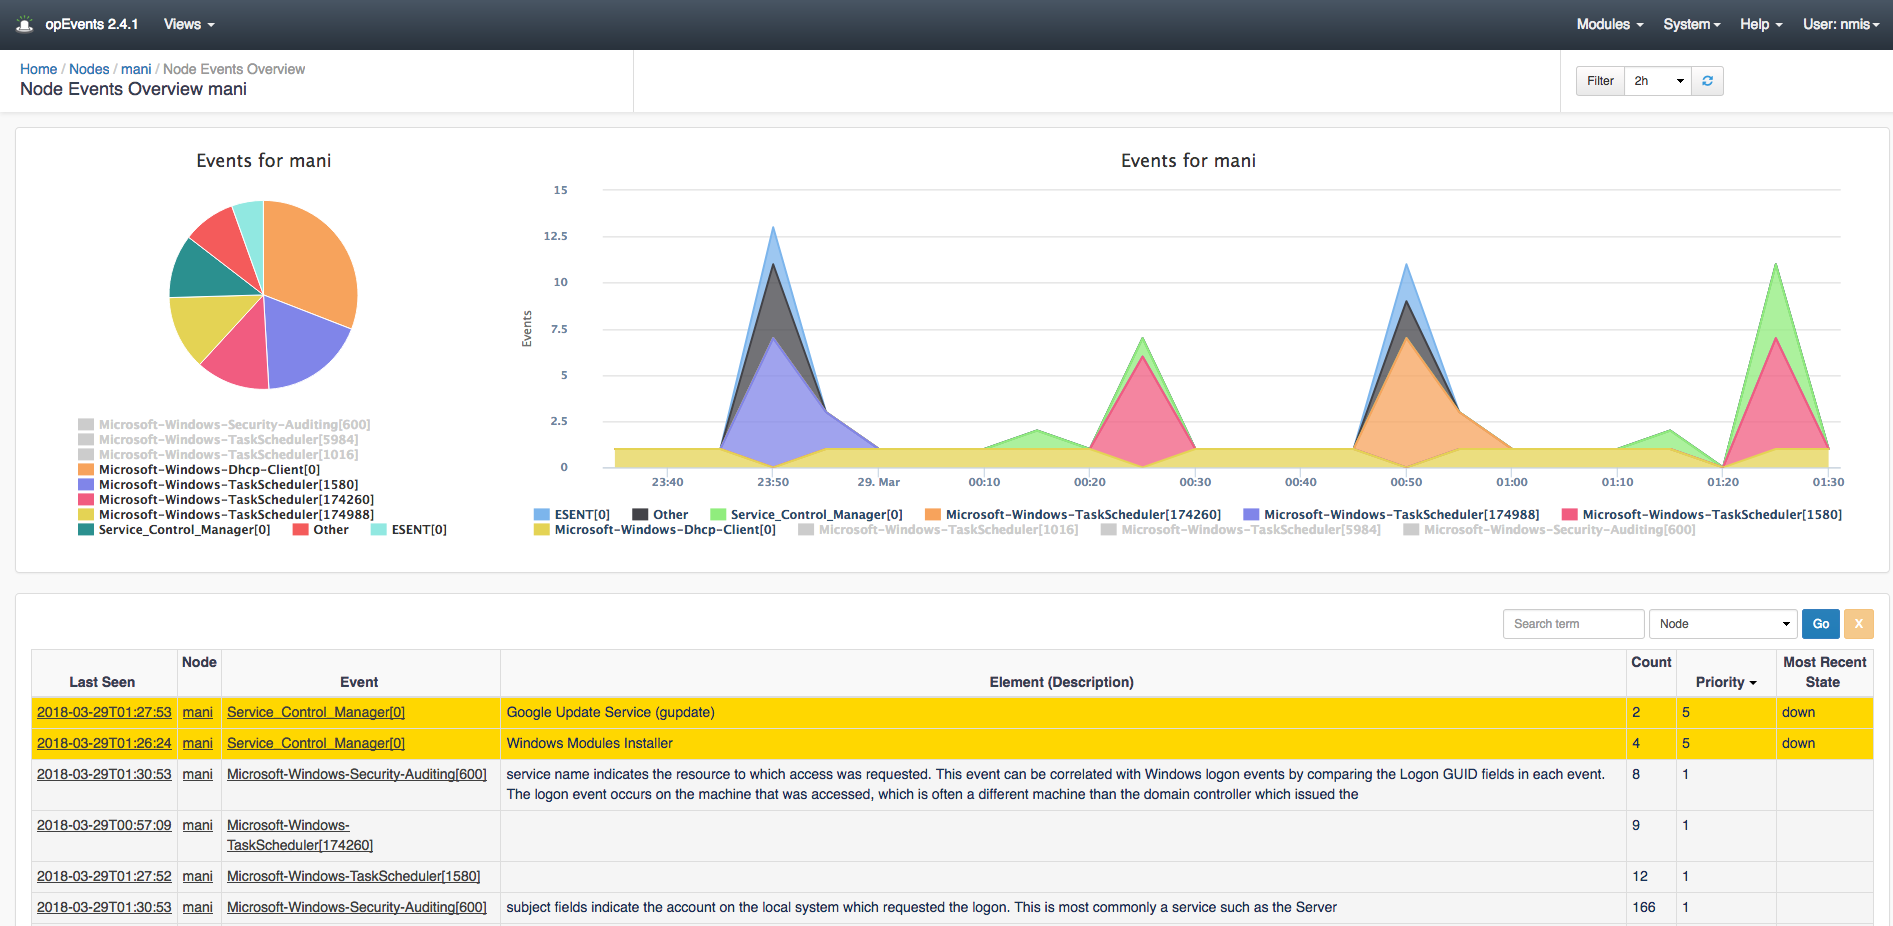
Other information provided on this screen is a Node Summary, Recent events for this device, Elements Up, and Elements Down. Clicking on the icons in the Elements Up and Down menus, clicking the Event Up and Event Down icons will open the Event Context page for that event. Clicking the Edit State icons you can either Toggle the State Up or Down, or Remove the State. Notice in the image above in the Recent Events for asgard section there is some blue text indicating that there are too many events for the table. If you click on this link it will open the Events view for this Node displaying all of the nodes events on one page.In this same section there is a blue "Overview" menu item, clicking on this will open the Node Events Overview page for this device. This page is similar to the default Dashboard page however, it is only displaying the events for this particular device. Same as the Dashboard page you can filter the time you want to view Events, filter events displayed on the charts, search for Events, and drill into each Event by clicking the Event link in the table below.
Events view
Navigating to menu Views -> Events you can see a bit more detailed view of the table on the Dashboards page. Notice above the table in the top left displays the total number of events along with the date and time period reported on. With added editions of the State and Acknowledged columns you see which events need action and which have already been acknowledged by another member of your team. This page has the search box and time filter options as well. If desired, you can change the page to display more than 25 events at a time by scrolling to the bottom of the page and selecting the drop down Show menu item. To the left of the Show menu item is a button which allows for this page to be exported to CSV granting you and your team the ability to share a detailed report of the events across your devices.
...