...
The actions view located at menu -> Views -> Actions displays the actions taken for any given event. Event actions are the conditions an event must conform to and what actions to take in case of a match. The event Date, Name, Node, Action, Details, and Comment section is displayed on the table. These items on the table can be customized to your liking by adding or taking away information displayed on this page. These changes can be made by navigating to /usr/local/omk/conf/table_schemas and editing the opEvents_action-log.json file. We have a Wiki page written up on how to edit these values here: opEvents 2.4.x - Customising Table Columns. You can sort these events clicking each Table header and click their links as well for detailed information. Similar to the Events view you can download it as a CSV and choose to display more events on the page from the Show drop down menu. The table can be customized to display more or less information
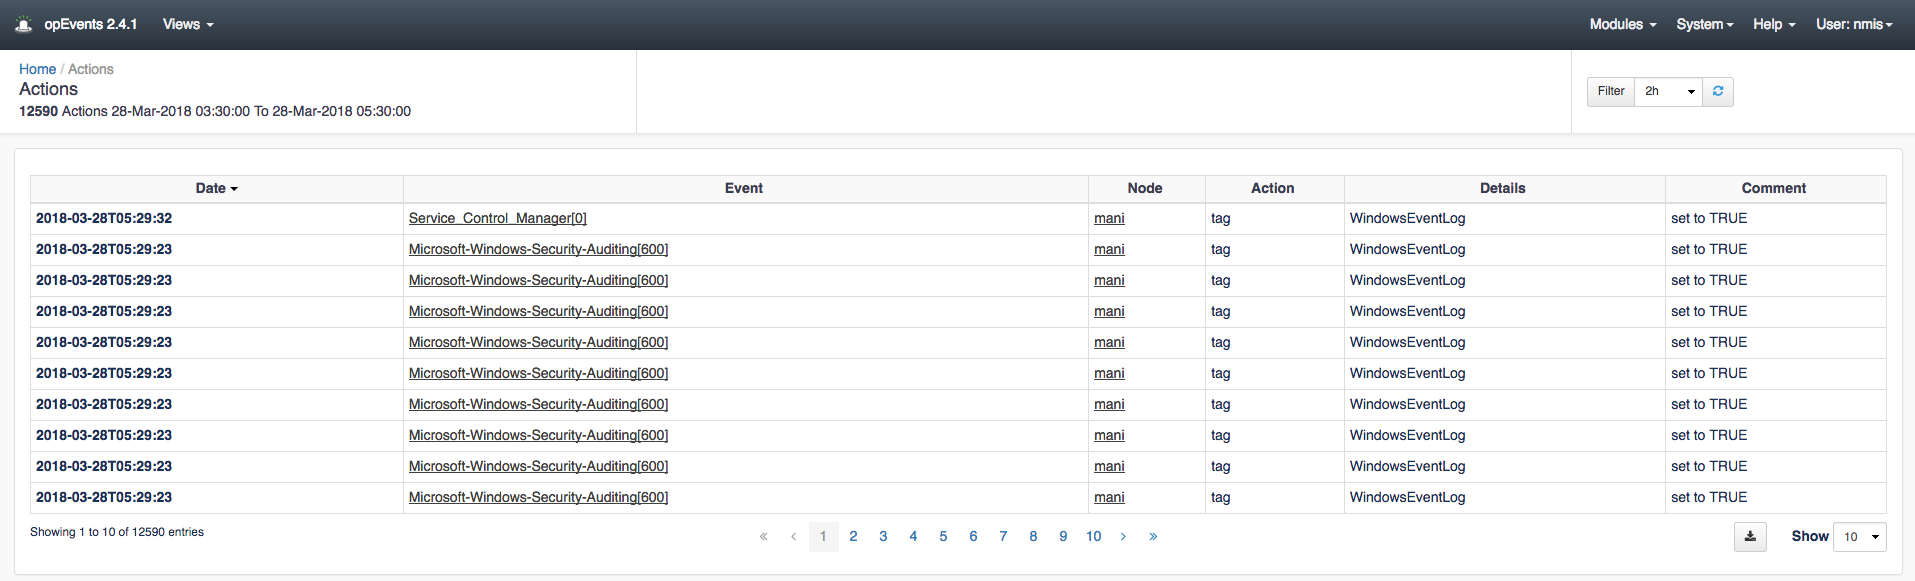
More detail on what Actions can be managed can be found here: Event Actions and Escalation
...
The Raw Logs view displays the current raw event logs. This view is useful for viewing what the full event message says within the Entry column. Clicking the Event ID link will open up the Event Details page for the chosen event. As with other views, you can export this information to CSV by clicking the Export to CSV button to the left of the Show drop down menu which of course allows for more events to be displayed on the page. The time filter in the top right of the page will also make viewing specific events quicker. These items on the table can be customized to your liking by adding or taking away information displayed on this page. These changes can be made by navigating to /usr/local/omk/conf/table_schemas and editing the opEvents_raw-log.json file. We have a Wiki page written up that goes into more detail on how to edit these values here: opEvents 2.4.x - Customising Table Columns.
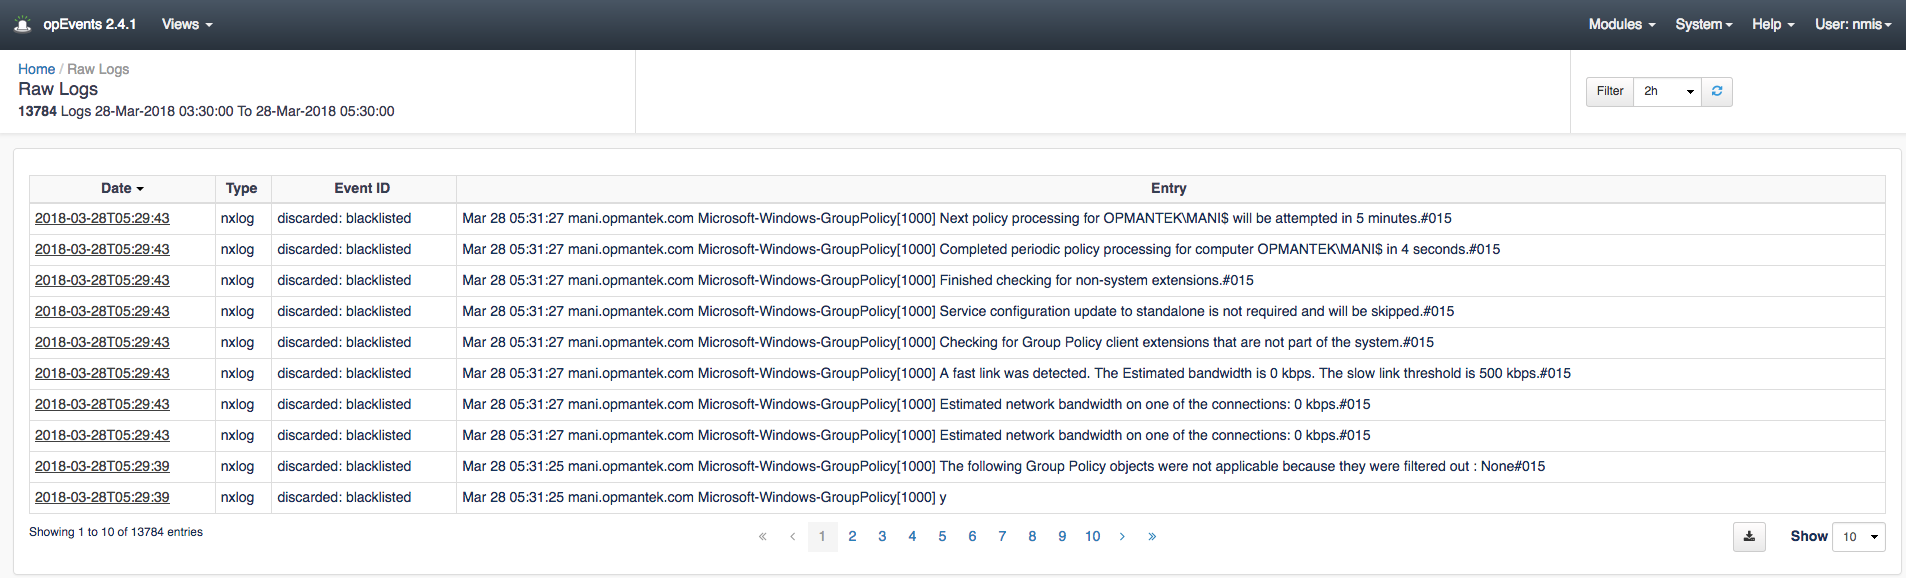
Clicking on the link in the Date column will open up the Raw Log Details page providing you with more details of the selected log. An example of this page is provided below:
...
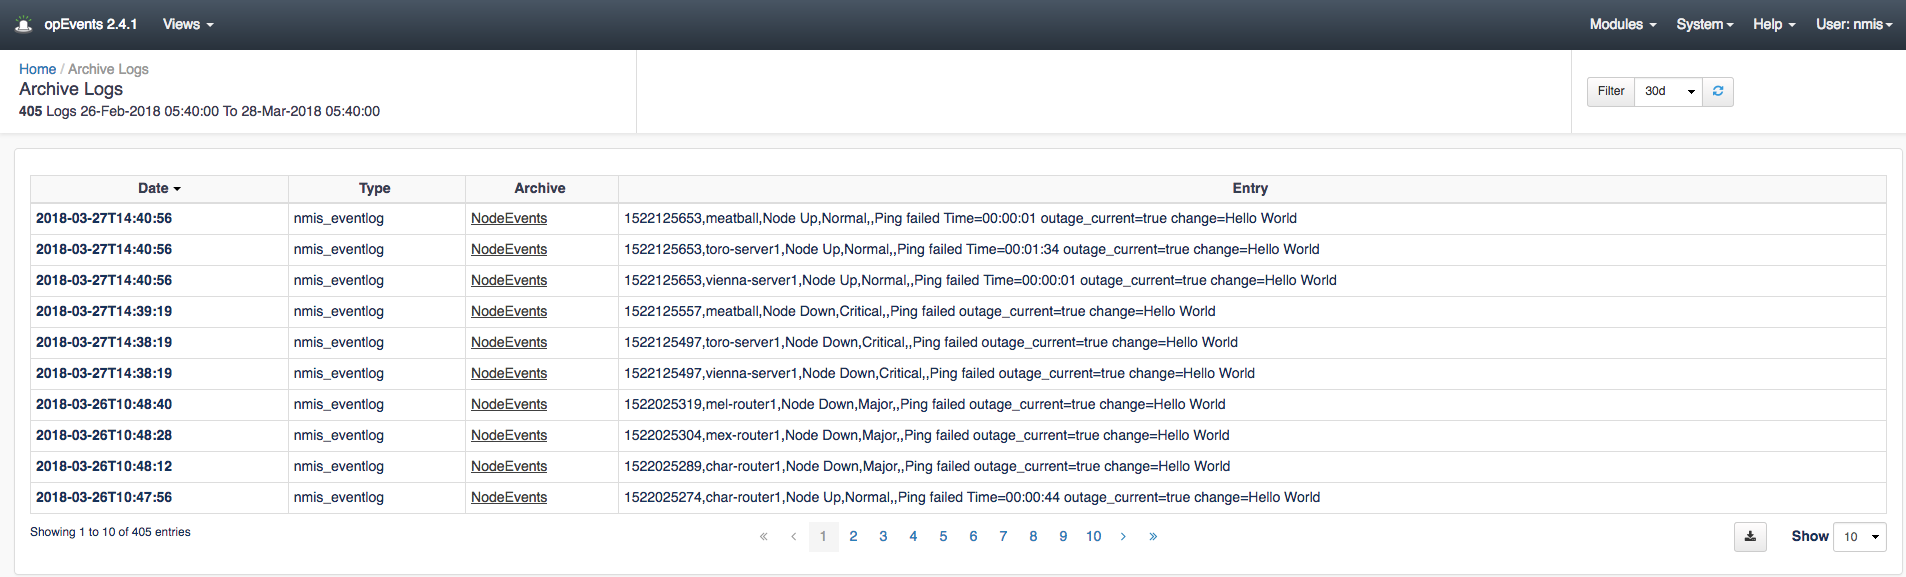
Archive Logs view lets you see the archived logs along with their type of log and an Entry description. The Filter on the top right of the page lets you choose how many days you want to look back for these logs depending on your log rotation setup. As with other views, this page can be Exported to CSV by clicking the Export to CSV by clicking the button to the left of the Show drop down menu which will allow for more events to be displayed on the page. Clicking the links within the Archive column will open up an Archive Logs Details page that displays the _id of the event along with the details from the Archive Logs view pertaining to that particular event. These items on the table can also be customized to your liking by adding or taking away information displayed on this page. These changes can be made by navigating to /usr/local/omk/conf/table_schemas and editing the opEvents_archive-log.json file. For more information on this process we have documentation that goes into more detail on how to edit these values here: opEvents 2.4.x - Customising Table Columns.
Nodes View
The Nodes View displays a list of all Nodes, their Group, Location, Customer, Business Service(s), and their Host. This view allows you to quickly search for a specific node to view it's events by using the search box in the top right of the page. If desired you can click the Export to CSV button to generate a copy of this page in CSV format. This button is located to the left of the Show drop down menu. The show drop down menu lets you choose how many devices to display on the page. Clicking on a node in the Name column will open op the devices Node Context page allowing you to view more detailed information.
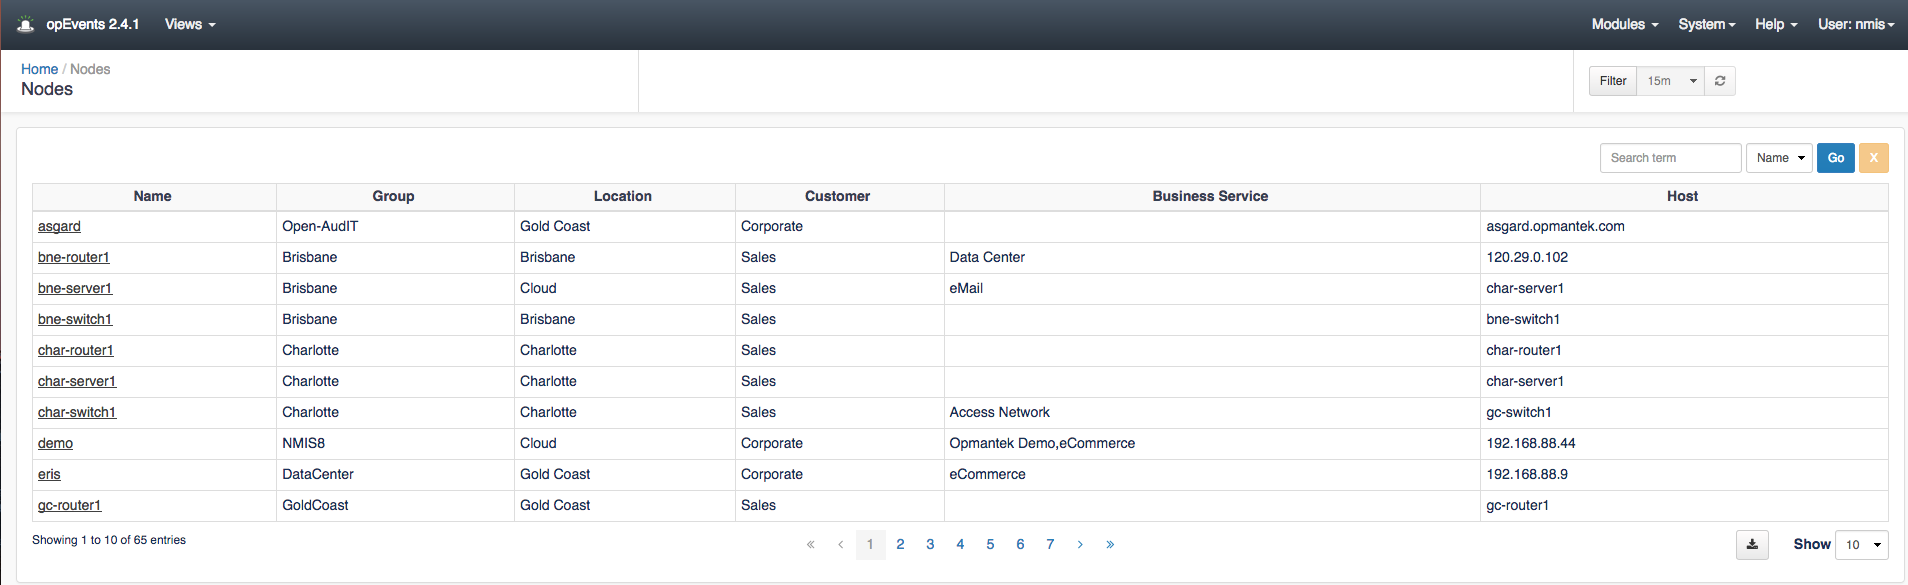
These items on the table can also be customized to your liking by adding or taking away information displayed on this page. These changes can be made by navigating to /usr/local/omk/conf/table_schemas and editing the opEvents_node-log.json. For more information on this process we have documentation that goes into more detail on how to edit these values here: opEvents 2.4.x - Customising Table Columns.
Summary Reports View
The Summary Reports View gives you details on all of the reports generated. These reports can be downloaded in an XLSX file by clicking the download button in the XLSX column. The Show drop down menu chooses how many summaries to show on this page. Similar to other pages mentioned above, these items on the table can also be customized to your liking by adding or taking away information displayed on this page. These changes can be made by navigating to /usr/local/omk/conf/table_schemas and editing the opEvents_summary-reports.json. For more information on this process we have documentation that goes into more detail on how to edit these values here: opEvents 2.4.x - Customising Table Columns.
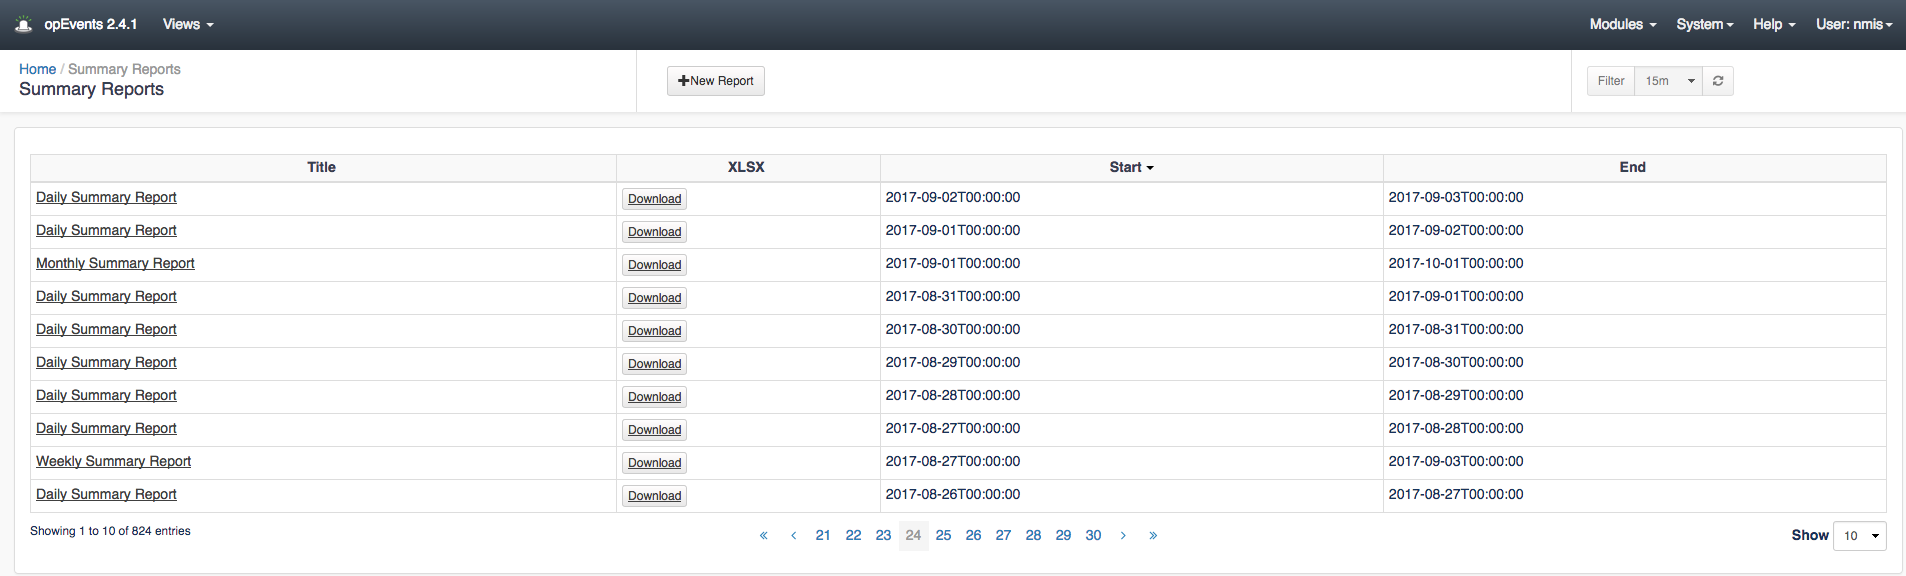
By clicking the "New Report" button you can create a custom report. Simply enter a Report Title and the Report Period to report on and click Generate Report.
...