...
Step 5
Create a script which will get to the appropriate WEB Application URL, use the basic http service as a basis. The name of the service must be the same as the name of the script!
| Code Block |
|---|
cp /usr/local/nmis8/conf/scripts/http /usr/local/nmis8/conf/scripts/nmis |
Then edit that script and change the script to get your URL correctly, in this example the final nmis script looked like this:
| Code Block |
|---|
send: HEAD /nmis8/ HTTP/1.0 send: expect: 200 OK |
So this script will connect to port 80, send the "HEAD /nmis8/ HTTP/1.0" and a newline, the most basic if of HTTP Headers, the response it would get would be:
| Code Block |
|---|
HTTP/1.1 200 OK Date: Tue, 01 Apr 2014 05:19:19 GMT Server: Apache/2.2.15 (CentOS) Last-Modified: Thu, 21 Mar 2013 05:14:21 GMT ETag: "a233b-67c-4d8686950cd27" Accept-Ranges: bytes Content-Length: 1660 Vary: Accept-Encoding Connection: close Content-Type: text/html; charset=UTF-8 |
The expect would match the data "200 OK" and declare success. More complex requests could be made here. E.g. checking a database status using HTTP.
Monitoring Services with external programs
Starting with version 8.4.10G nmis can also run external programs to test a service status. To interoperate with NMIS such a program must conform to a few simple rules which are described below.
The steps for enabling this facility are mostly the same as for the other service types, except for the service definition of course. The dialog for Adding or Editing Services now shows some extra options:
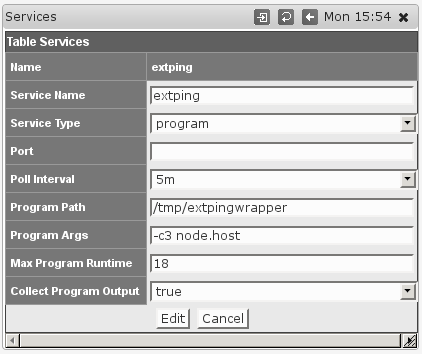
Choosing the Service Type program activates the options for running external programs; they are ignored for all other Service Types.
- Program Path must point to the program in question, and must be an absolute path (i.e. starting with
/). This setting is clearly mandatory, and the program in question must be directly executable by thenmisuser. - Program Args defines arguments that are to be given to this program when run. This is an optional setting.
Any tokens of the form"node.something" will be replaced by the corresponding property of this node; most likely you will want to usenode.hostfor the node's dns name or network address,node.namefor the logical node name, maybe evennode.sysContact. To determine the available properties check the 'system' section of/usr/local/nmis8/var/yournode-node.nmis(or .json). - Max Program Runtime sets the upper limit (in seconds) for how long NMIS will wait for this program to complete.
If the program has not finished by that time then it's terminated forcibly and the service is marked 'down'. This setting is optional, but highly recommended - if you don't set a limit then a single uncooperative external program could delay all NMIS collect or update operations indefinitely! - Collect Program Output defines whether extra output by the program is to be collected and stored, or ignored.
The external program must follow these interfacing rules to work with NMIS:
- Your external program must report the service status by returning an exit code between 0 and 100 inclusive.
0 means the services is down, 100 means the service is considered up and running perfectly, and values inbetween is interpreted as up-but-degraded. The service graphs do show the precise value.
New in NMIS 8.5.10: NMIS now distinguishes degraded services properly, shows them in a different color than up services and creates "Service Degraded" events (not just "Service Down"). - Your external program can't read from stdin, and needs to finish its work and terminate as quickly as feasible; NMIS cannot proceed with further operations until the external program terminates.
- New in NMIS 8.5.10: Your external program may provide a textual service status as the first line of output, which NMIS captures (if "Collect Program Output" is enabled), displays and includes in any events.
Such a textual service status is also displayed when the service is up. If you would like to record custom numeric values from your service as described below your script must first return some text status, it should only then return the key=value as below. - Your external program may report numeric values back to NMIS by printing
key=valuepairs on stdout, one pair per line.
If the Collect Program Output option is enabled, then NMIS will collect these values and store them in the RRD database and the node file. Note you must first return a status string as above, only the subsequent lines of output will be interpreted as numeric values for "Custom Measurements"
The keyresponsetimeis special: any numeric value given for it will be used directly in the service and service response time graphs.
Please note that NMIS is somewhat picky where file permissions are concerned. With the default configuration it controls all files under /usr/local/nmis8 and it will strip the execute permissions from all files not named something.sh or something.pl. This clearly affects the acceptable names for your external programs if you want to save them anywhere within the NMIS dir.
A simple adjustment can be made to relax this strictness:
| Code Block |
|---|
'nmis_executable' => '(/(bin|admin)/[a-zA-Z0-9_\\.-]+|\\.pl|\\.sh)$', |
Setting the Config.nmis option nmis_executable to the above would instruct NMIS to treat all files in /usr/local/nmis8/bin and and /admin, as well as any .pl and .sh files as executables.
Monitoing services with an external program in this fashion is easy to implement, but slightly limited in functionality; if you require access to all the advanced event management and alerting features of NMIS for a service then we recommend that you extend your snmpd for this service instead of using the external program facility.
Using Nagios Plugins for service monitoring (new in NMIS 8.5.10)
Starting with NMIS 8.5.10 a new service type nagios-plugin is available. All options described for "external programs" above apply unchanged, and the "Program Path" has to point to the Nagios plugin that you'd like to make use of. (There are two well-known sites that collect Nagios plugins, https://www.monitoring-plugins.org/ and http://nagios-plugins.org/.)
NMIS interprets the Nagios states OK as "service up/100", Warning as "degraded/50" and states Critical and Unknown as "down/0".
At this time Nagios' optional "unit of measure" and "min/max/warning level" returns are ignored. Any "performance data" (as Nagios calls extra numeric service status data) that your plugin might return is collected if the "Collect Program Output" option is active.
New service monitoring displays in NMIS 8.5.10
NMIS 8.5.10 adds new screens for service overview and service details.
The overview screen listing all monitored services is reached via "Monitored Services" in the "Service Desk" or "Network Status" menus.
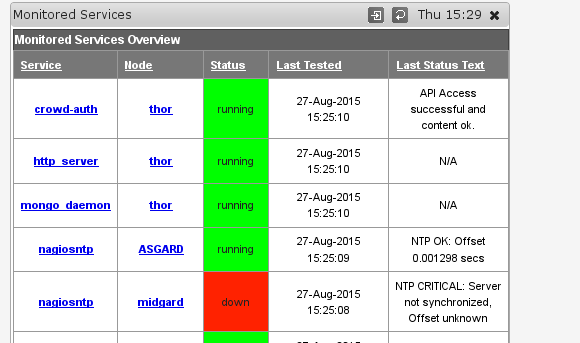
As you can see three of the five services shown do make use of the new status text collection (for Service Types "program" and "nagios-plugin").
Clicking on any of the "Service" links brings up the service detail page for this service on this node. (The same details page is also reachable from a node's "services" tab and from its main node details screen.)

As you can see this service also collects extra metrics, in this case "offset". The graph is clickable, as are the two status and response time columns; all send you to the well-known "graph drill-in" page.
Custom Graphs for Services (new in NMIS 8.5.10)
If your monitored service is program or nagios-plugin based, then you may want to collect and graph extra numeric data (what Nagios calls "performance data"). Collection and RRD-storage has been possible since 8.4.10G, but support for comfortably making and displaying custom graphs is new.
NMIS 8.5.10 provides a new helper program, ./admin/service_graph_helper.pl which guides you interactively through the process of selecting a service, its (standard or custom) measurements you'd like to graph, what graph styles you'd like them to have (line or just textual prints) and colors. This tool is menu-based and results in nice custom graph definitions for NMIS.
The new service details view now displays any custom graphs that might be available for a particular service, like in the example screenshot below:
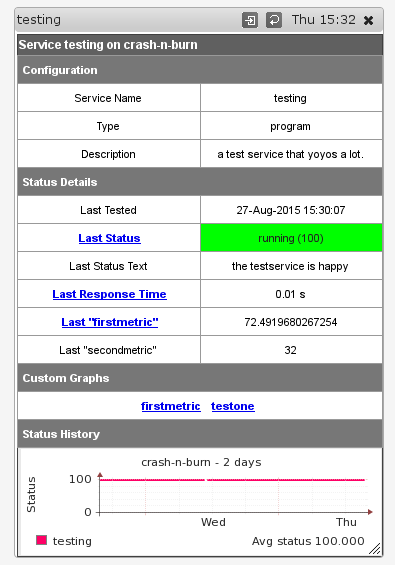
In this example, a custom graph for just the "firstmetric" extra mesurement was created which is accessible both via the "Last firstmetric" column as well as the list of custom graphs below. The other custom graph, "testone", displays more than one measurement.