NMIS has a history of being a Network Management System, the generation of the Metrics and now KPI's is something which makes NMIS more than a Network Monitoring System and helps IT professionals with better information about their environment on which to base decisions. In
In NMIS 8.5, Key Performance Indicators (KPI's) were added to help see how the health metrics are comparing over time.
| Table of Contents |
|---|
Overview of KPI's in NMIS
KPI's were introduced into NMIS to provide insight as to why the health of a node was getting better or worse. As discussed in the article on NMIS Metrics, Reachability, Availability and Health, NMIS is tracking the health of a node and providing a single number which indicates what the health of a node is, this is called the Health Metric. To make up the Health Metric, NMIS is tracking many aspects of a nodes health including:
...
In NMIS 8.5G we started storing the individual KPI scores so that it was possible to see the health metric break down over time. This is now shown at the top of a node view panel in NMIS8 and looks like this:the image below.
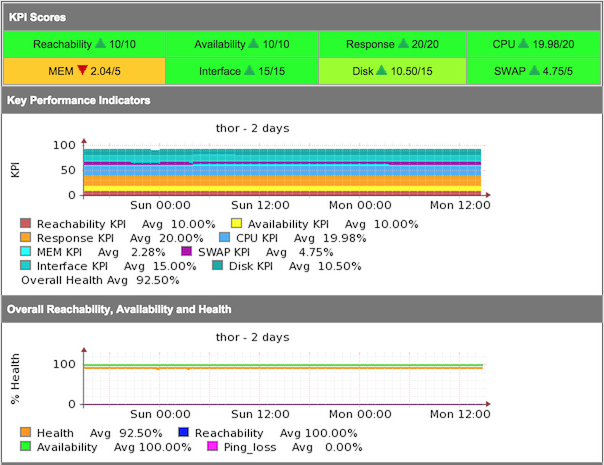
KPI Scores
You can think of the KPI Scores like a report card, the student (node) has received 10/10 for English (reachability), 10/10 for Maths (availability) and so on. The KPI Scores in the screenshot above come from the polled data and are scored out of the weighted value, this weighted value is a percentage, so in the configuration file it is 0.1 which means it is 10% or a maximum possible KPI score of 10/10. The table below shows the configuration value and the resulting KPI Score value.
...
The result is that all the maximum KPI Score for a node will be 100 or 100%.
Interpreting Health and KPI Values
So you are looking at the main NMIS dashboard and you see that a node has a Health score of 92.2% as the example below, there is also a red arrow beside that, which is the result of the longstanding NMIS feature for auto baselining, this red arrow is point down, meaning that the health now is lower than the last period, you can read more about NMIS Auto Baselining.
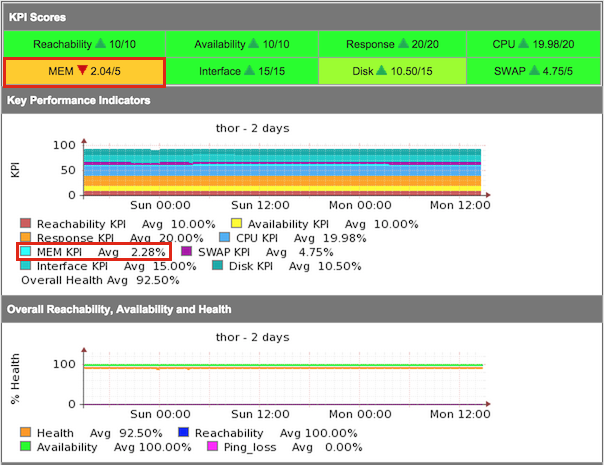
So WHY is this node less health healthy now than it was before, clicking on the node will reveal the KPI scores and we can start looking at what is changing.
...
So now we see this KPI summary again, we can see the overall breakdown of the health metric represented in the KPI values and we can see that the MEM KPI has a red arrow pointing down, the auto baselining is showing us that the Memory score is lower than previously with a score of 2.04 out of a possible score of 5. If we look at the graph of the last 2 days, we can see that the average value for the MEM KPI is 2.28%, showing us that the memory utilisation has changed increased a little.
If we want to know WHY the health from the front page is 92.2% we can look at all the KPI values, like the Disk KPI of 10.50/15, CPU KPI is 19.98/20 and SWAP KPI is 4.75/5, we can take 100% and subtract the remainders so,
| KPI Item | Configuration Item | Configured Weighting | Maximum KPI Score |
|---|---|---|---|
| Reachability | weight_reachability | 0.1 | 10 (10%) |
| Availability | weight_availability | 0.1 | 10 (10%) |
| Response | weight_response | 0.2 | 20 (20%) |
| CPU | weight_cpu | 0.2 | 20 (20%) |
| Memory | weight_mem | 0.1 x 50% | 5 (5%) |
| Swap | weight_mem | 0.1 x 50% | 5 (5%) |
| Interface | weight_int | 0.3 x 50% | 15 (15%) |
| Disk | weight_int | 0.3 x 50% | 15 (15%) |
| KPI Score | Remainder Calculation | Health Remainders | |
| Reachability | 10/10 | 10 - 10 | 0 |
| Availability | 10/10 | 10 - 10 | 0 |
| Response | 20/20 | 20 - 20 | 0 |
| CPU | 19.98/20 | 20 - 19.98 | 0.02 |
| Memory | 2.04/5 | 5 - 2.04 | 2.96 |
| Swap | 4.75/5 | 5 - 4.75 | 0.25 |
| Interface | 15/15 | 15 - 15 | 0 |
| Disk | 10.5/15 | 15 - 10.5 | 4.5 |
Adding together the Health Reduction results and subtracting from 100 gives us: 100 - (0.02 + 2.96 + 0.25 + 4.5) = 92.27%
The difference between the result and the displayed numbers are rounding precision.
Conclusion
NMIS KPI Scores are a powerful way to get to the bottom of the health of your infrastructure, they will assist to see where resources are being used and assist to identify operational problems very fast.