...
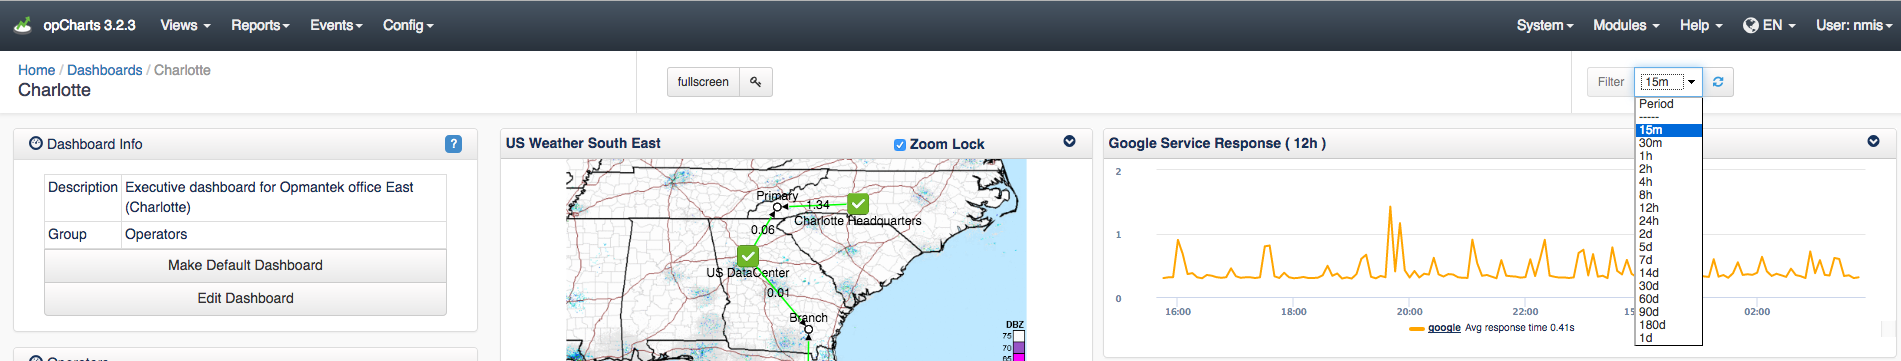
The opCharts menu bar includes a Filter field where you can select a time period to use in the current dashboard. This drop-down listbox is defined in opCommon.nmis under "opcharts_gui_period_values"
Adjusting node
...
selector attributes
The opCharts Node Selector shows a list of attributes that can be selected to filter which nodes are shown in the nodes screen. If you are using custom attributes or want to be able to select nodes based on other attributes not shown such as Location or Business Service you can vary the selections by changing what is in "opcharts_node_selector_sections" in opCommon.nmis. The same updates can be made to the Monitored Services Selector filters with the attributes in "opcharts_monitored_service_selector_sections"

In opCommon.nmis Changechange:
| Code Block | ||||
|---|---|---|---|---|
| ||||
'opcharts_node_selector_sections' => [
	  {
        'key' => 'nodestatus',
        'name' => 'Node Status'
      },
      {
        'key' => 'group',
        'name' => 'Group'
      },
# other default atttributesattributes not shown for brevity
## adding in location as an attribute to filter by:
	  {
        'key' => 'location',
        'name' => 'Location'
      },
|
...
Changing from prefetch to remote will also allow a more comprehensive search. The prefetch search looks slightly nicer but only searches from start of the word, remote search will search all parts of the word (host/node name).
In opCommon.nmis Changechange:
| Code Block |
|---|
'opcharts_gui_node_search_mode' => 'prefetch’, # <- uses prefetched data to do the search locally |
...