Traffic Snapshot Reports
Requirements
Exercise caution while editing /path/to/omk/conf/opCommon.json; if a syntax error is induced all OMK applications will cease to function.
Check out How to make configuration changes to opCommon.nmis and other files for some more details on best practices for modifying the configuration file.
opReports 4 requires that configuration item omkd → omkd_url_base in /path/to/omk/conf/opCommon.json be set to the IP address or FQDN of the server,
and be prepended by the HyperText Transfer Protocol ( http:// or https:// ),
for the Traffic Snapshot Report to function correctly.- opReports requires that a licensed opCharts be installed and that the opCharts EULA be accepted for the Snapshot Report to function correctly.
Introduction
The Traffic Snapshot report requires a deep structure to describe each of its multiple pages.
Each page covers the (interface) members of one or more opCharts Business Services; utilisation data is computed and shown for all members of a business service combined, but graphs are presented for each interface separately.
Sample report and how to configure
Number | Configuration Option | Description |
|---|---|---|
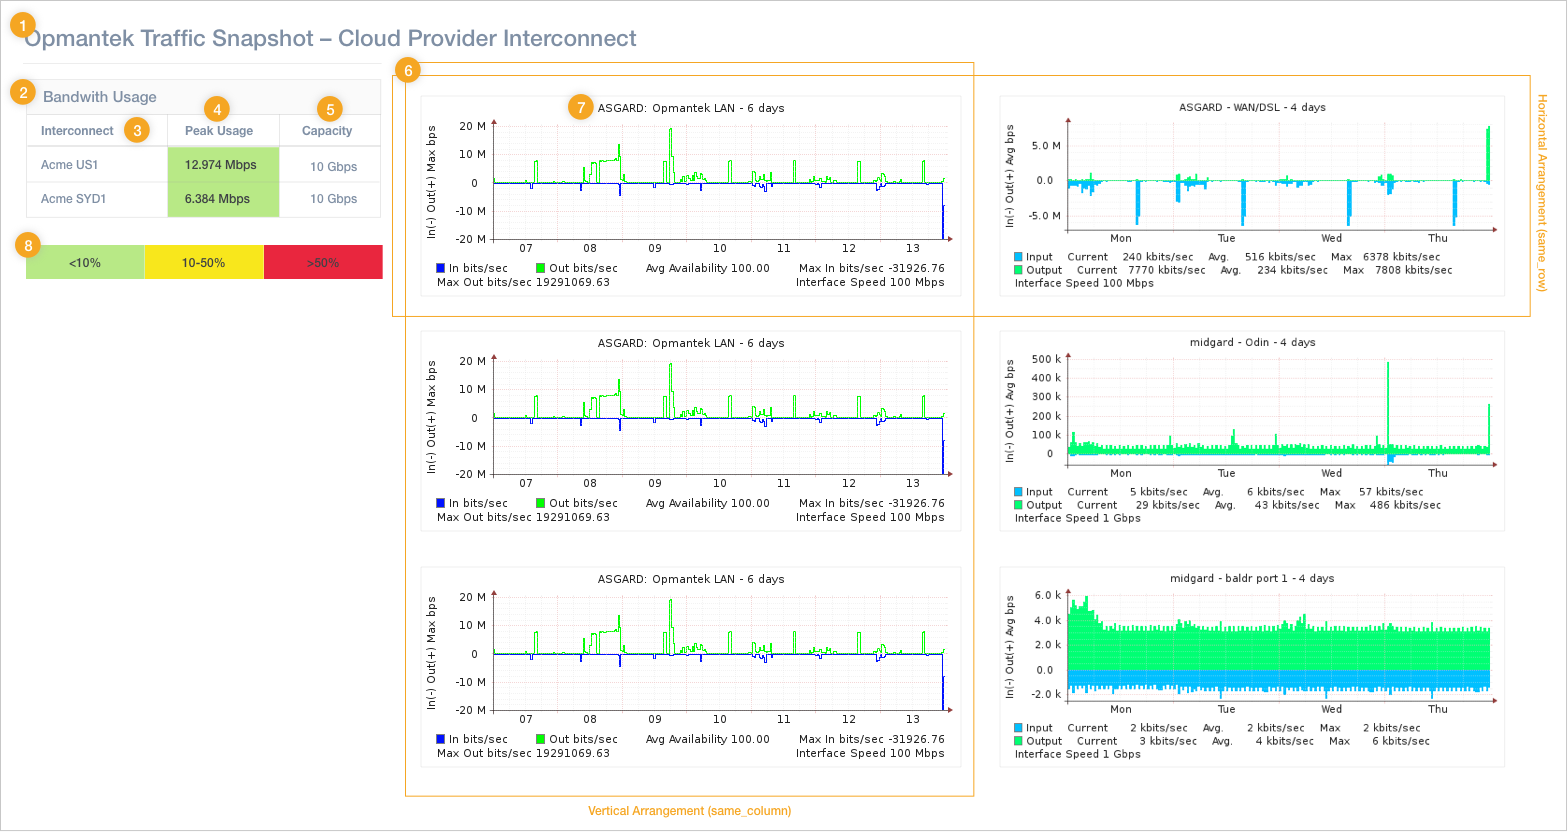
1 | Title | Page title. Every page can have its own title; If not set, "Page <nr>" is used. |
2 | Summary Title | This title text is shown before the Summary Table. If not set it's omitted. |
3 | Table Column Heading | The heading is meant for the first column in the table, which enumerates the Business Services you've selected. |
4 | Peak Type | The "Peak Utilisation" can be the combined sum of utilisation figures across the group, or the utilisation of one "busiest" interface. |
5 | Capacity Type | The "Capacity" can be the combined sum of capacities across the group, or the capacity of the one "slowest" interface. |
6 | Graph Order | Graphs for the interfaces of a given Business Service can be grouped horizontally or vertically. |
7 | Graph | For each interface, the named NMIS graph is generated. |
8 | Level Color Scheme | Coloring scheme for utilisation levels |
Report-Specific Settings
Multiple Pages for Traffic Snapshot Report
In a schedule file this structure is known as pages, and it is passed to opreports-cli serialised in dot-notation form.
The pages structure must contain a list of page definitions, each with the following properties:
Property | Description |
|---|---|
| A list of business service names that should be shown on this page. Required. Ordering is relevant. |
| A hash sub-structure with report options that are specific to this one page. |
The options structure supports the following settings:
Per-Page Options Property | Description |
|---|---|
| The title for this report page. Optional; if not present "Page <N>" is used. |
| The summary title is shown above the utilisation summary table. Optional; if not present "Utilisation Summary" is used. |
| The value of this property is used as table column heading for the business service column in the summary table. Optional; if not present, "Interfaces" is used. |
| The name of the NMIS graph to produce for each selected interface. Required. Note that the "short name" of the graph is to be used, e.g. "autil", not "Interface Utilisation including Availability". |
| The graphs for all members of one business service group will be arranged in the selected order. |
| A hash sub-structure that describes the desired coloring scheme for this page, based on utilisation level. Optional; if not present, then the levels from the global configuration option |
Level Color Schemes
The coloring rules must be set separately for each page.
To simplify reuse the schedule editing GUI will let you pick only from existing schemes that are defined in opCommon.nmis: the color level schemes must be attached to the configuration item report_snapshot_levels, and each scheme must have its own key. opReports ships with two example schemes to illustrate this setup.
In both cases (for editing a schedule by hand, or for preparing reusable color schemes in the config), the levels structure must be a deep hash structure, key being the level 'name', each value being a structure with the following properties:
Level Property | Description |
|---|---|
| The displayed label for this level. |
| A number. The lowest level with a utilisation figure (strictly) higher than the threshold 'wins'. The lowest defined level should have a negative threshold. |
| A color name or a "#RRGGBB" HTML-style color specification. This color is used for the cell background of the 'Peak' column. The color name must be one of the ones that XLSX supports; RGB is more robust. |
How levels and peak/capacity types interact
The utilisation summary table contains three columns:
the name of the Business Service for this group
the "Peak Utilisation" for the whole group, in bits/second (formatted with suitable unit suffix),
and the "Capacity" for the whole group, in bits/second.
The "Peak Utilisation" can be the combined sum of utilisation figures across the group, or the utilisation of one "busiest" interface.
The "Capacity" can be the combined sum of capacities across the group, or the capacity of the one "slowest" interface.
Please note that depending on your configuration choices, the displayed Peak can be higher than Capacity (by some orders of magnitude).
For coloring, the utilisation ratio is computed as peak divided by capacity; this can be above 1.0 (or 100%) as per the caveat above.
The peak and capacity options other than combined are mainly meant for business services that represent identical pairs of interfaces each, one active, one standby; in all other case the caveat above applies.
The Peak Utilisation column is colored according to the levels option: the first level whose threshold is strictly lower than the utilisation ratio is the one setting the color.
E.g. with a ratio 0.0 or 0% (an idle interface group) and level thresholds -1, 25 and 75, the level with threshold -1 will be controlling the color. If the ratio was 0.74 or 74%, the middle level would win, and only if the ratio was above 0.75 or 75% would the last level be involved in coloring.
Option | Description |
|---|---|
| One of Combined: The peak utilisation for the interface group is defined as the sum of all involved interfaces' traffic. Busiest by Bits: The peak utilisation is sourced from the one interface with the highest traffic figure. Busiest by Utilisation: The peak utilisation is sourced from the one interface with the highest ratio of traffic to configured interface capacity. |
| One of |
Here is an complete example Snapshot Report Schedule in JSON form:
{
    "active": false,
    "description": "an example weekly snapshot report",
    "type": "snapshot",
    "outputdir": "/usr/local/omk/var/reports",
    "start": "mon 00:00",
    "end": "sun: 24:00",
    "frequency": "weekly",
    "formats": {
        "csv": true,
        "xlsx": true,
        "html": true
    },
    "options": {
        "peak_type": "combined",
        "capacity_type": "combined"
    },
    "pages": [{
        "business_services": ["first service", "second service"],
        "options": {
            "title": "this is page one",
            "graph_order": "same_row",
            "graph": "abits",
            "summary_title": "this is summary one",
            "column_heading": "Links on page one",
            "levels": {
                "low": {
                    "color": "green",
                    "description": "low util",
                    "threshold": -1
                },
                "high": {
                    "color": "red",
                    "description": "high util",
                    "threshold": 50
                }
            }
        }
    }, {
        "options": {
            "graph": "autil",
            "summary_title": "this is summary two",
            "column_heading": "Other Intfs",
            "title": "page two",
            "graph_order": "same_column",
            "levels": {
                "boring": {
                    "color": "#00ff00",
                    "description": "30-60%",
                    "threshold": 30
                },
                "third": {
                    "description": "1-30%",
                    "color": "#008000",
                    "threshold": 1
                },
                "attic": {
                    "color": "#ffa31a",
                    "description": "above 80%",
                    "threshold": 80
                },
                "ground": {
                    "color": "#004d00",
                    "description": "under 1%",
                    "threshold": -1
                },
                "balcony": {
                    "threshold": 60,
                    "color": "#c6ff1a",
                    "description": "60-80%"
                }
            }
        },
        "business_services": ["another business service", "and one more with more intfs", "and maybe a last one, too"]
    }]
}