Released 10th December 2019

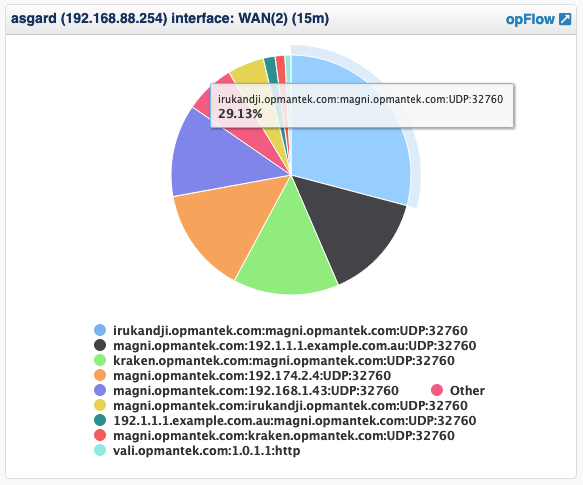
We have introduced a pie chart component which can be used with remote data.
Currently this is used to show flow data from opFlow.
Use "page_size": 10, in components top level JSON document change how many documents are requested and shown.
If this is not set it defaults to 15.
If you need to log the request for debug purposes this is done per component.
set "log_request" : true in remote_paramaters. Your omkd log_level will still need to be at log level debug.