Released 10th December 2019
Highlights
Pie Charts

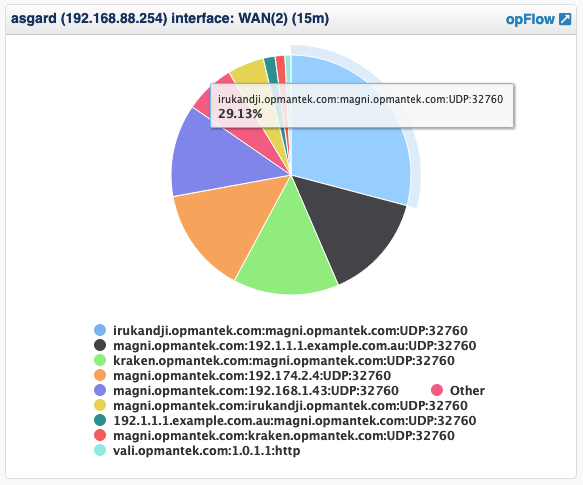
We have introduced a pie chart component which can be used with remote data.
Currently this is used to show flow data from opFlow.
Remote Table Component
Use "page_size": 10, in components top level JSON document change how many documents are requested and shown.
If this is not set it defaults to 15.
Resolved Issues
- Pie Component and Table Component now show the current selected time period in the title.
- The authentication option ms-ldaps is now supported.
- While editing a dashboard and changing its columns count it would fail update to this new value.
- Event History grid improved responsive for the search box.
- Updated log rotate file.

