At Opmantek we needed to find all the servers which were running log4j then upgrade them. Between our product, development and test servers we have about 50 Linux servers to check, checking manually was not an option, so we needed a quick automated way to identify the servers in question.
Opmantek doesn't use log4j (nor Java) in any of our products, nor do any of our direct dependencies use it, however some software used internally may use it - hence our need to find and patch it.
What do we want to automate, how do we detect the condition we want to detect. A simple analogy would be that if the doctors suspects you have a broken bone, they send you to get an x-ray, which confirms the injury or shows that the bone is not broken. This could be referred to as a diagnostic or test.
In this case I wanted to confirm if the log4j Java library was installed on the server, unfortunately, the software does not use a Linux package manager, so we can not use RPM and APT commands. There is a simple way to verify if the software was installed, look in / (root directory and all child directories) to see if there were any files containing the name log4j.
The Linux command I needed was:
Now I want to run this command quickly and easily on 50 Linux servers. A new command set was needed which I called "Linux_Log4j", I created a new command set file for this and similar things called "Linux_Software_Installed.nmis".
Command sets in opConfig are stored in /usr/local/omk/conf/command_sets.d by default. I copied an existing one and edited it to make it reflect what I needed, importantly this needed to have os_info matching Linux only and I needed to change the two commands, in the most recent version of opConfig for NMIS9 these files are JSON.
To understand the contents it is quite straightforward, os_info means, only run these commands when these os_info conditions are met. Each of the command sections are simple and the tagging system is powerful:
Change detection with change reporting is incredibly powerful, automated change detection to ensure compliance.
The final command set looks like this:
{
   "Linux_Log4j" : {
      "commands" : [
         {
            "privileged" : "true",
            "command" : "Log4jSearch",
            "exec" : "sudo find / -name \"*log4j*\"",
            "tags" : [
               "HOURLY",
               "Linux",
               "operations",
               "detect-change",
               "report-change"
            ]
         }
      ],
      "scheduling_info" : {
         "run_commands_on_separate_connection" : "false"
      },
      "os_info" : {
         "os" : "/(Linux|CentOS|Ubuntu)/"
      }
   }
} |
Because it is tagged with "HOURLY" the command set will run automatically every hour. If you want to run it manually for testing, you run the following command:
|
Check for any errors, if all good, run manually for all nodes or wait an hour or so.
You may need to increase the timeout if you see the console lines as below.
[2021-12-22 03:58:48.21513] [23682] [warn] failed to make session privileged: read timed-out [2021-12-22 03:58:48.21573] [23682] [warn] Failed to run command Log4jSearch: Could not make session privileged: read timed-out [2021-12-22 03:58:48.21587] [23682] [warn] Command timed out - partial response was: "" |
The /usr/local/omk/conf/opCommon.json file can be edited and the value for opconfig_command_timeout increased to a suitable number of seconds.
You may not have (or want to use) the privileged user (using sudo). In this case, a more suitable exec string is below (and remember to set "privileged": "false").
"exec" : "find / -name \"*log4j*\" 2>/dev/null", |
Now I can go to the opConfig GUI and find the matching nodes.
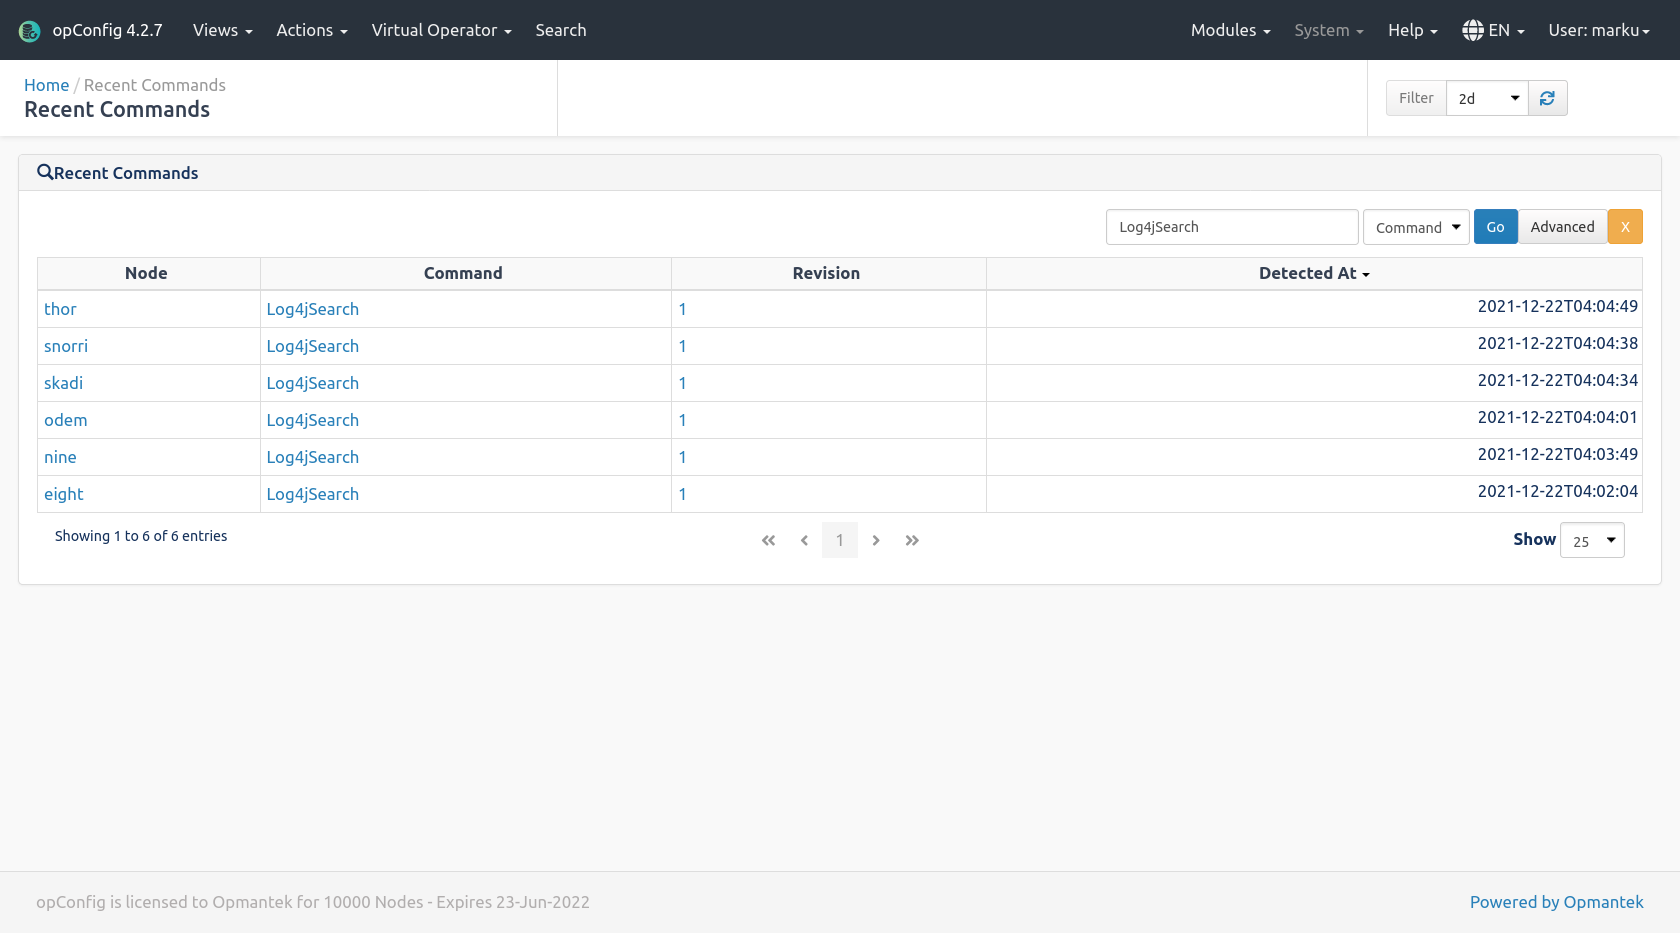
From the opConfig menu, select "Views → Recent Commands" and you should be seeing a screen which looks like the one below, first we can see how many instances of "Log4jSearch" we have collected.
In the box enter "Log4jSearch" change the select to "Command" and click "Go", you will have a list of nodes and the command name. Step 2 is to click on the "Advanced" button on the right.

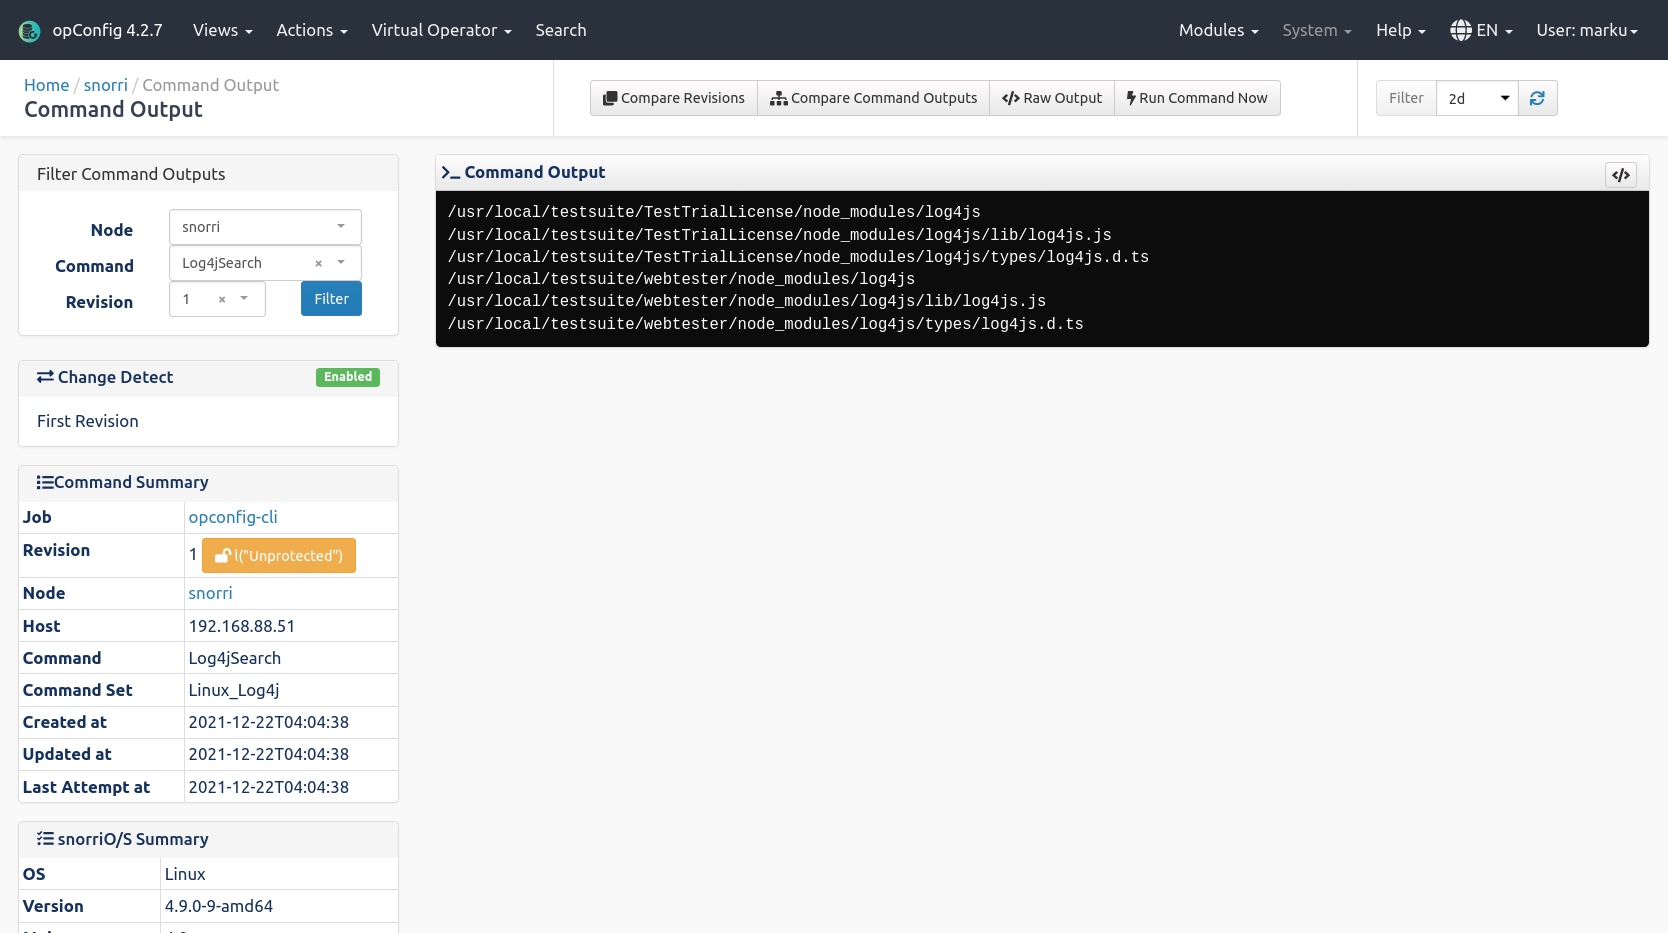
Click on the Node Name to see the command output.

And here we can see this node has some possible files of concern.
In this case remediation requires one of the operations team to install updated versions of Log4j or the packages from vendors using it. The Opmantek development team use Vagrant to automate this kind of activity and this issue will be resolved quickly.
Using Operational Process Automation methodology of detect, diagnose and action, Opmantek was able to identify the servers requiring the change quickly (about 15 minutes) and then complete the remediation.