NMIS8 is a powerful network management system, but NMIS is not only a network management system: it performs Windows and Unix server monitoring out of the box if your server supports SNMP. NMIS8 works well with Windows servers and especially with the popular NET-SNMP SNMP daemon, which is widely used on Linux and other Unix systems.
The core of NMIS server management is the Host Resources MIB, which is standardised in RFC2790, both the NET-SNMP, Windows SNMP and VMware ESXi daemons implement the Host Resources MIB. But NMIS is not relying on SNMP exclusively; it has capabilities for performance and fault management of servers, as well as service (application) monitoring running on servers.
This document describes a few common approaches towards service monitoring with or without using SNMP.
NMIS8 collects and stores the following performance data from servers:
Service Monitoring
You can download NMIS from the Opmantek webpage.
Depends on Windows SNMP Service (often referred to as agentless server monitoring). NMIS will collect the following information from Windows Servers in addition to the already described information.
All of these information requires no Agent to be installed onto the Windows server other than the freely available Windows SNMP Service (part of the Windows installation and setup).
Depends on NET-SNMP daemon being installed and configured, usually installed by default on most Unix platforms. Instructions for installing the NET-SNMP daemon are included in the NMIS 8 Installation Guide.
An updated services file "Services.nmis" was distributed with later NMIS8 versions, and is attached to this page Services.nmis, this is compatible with earlier versions of NMIS8. This file includes definitions for using the script method to poll HTTP, as well as monitoring for a MySQL daemon, and various ports using NMAP connections. Once Services.nmis is copied to /usr/local/nmis8/conf, you should verify that you have the scripts folder in nmis8, this is included in the install directory. Running cp -r /usr/local/nmis8/install/scripts /usr/local/nmis8/conf will ensure the service definition files are available.
When a service "outage" is detected you will receive NMIS events and notifications if NMIS has been configured to do so.
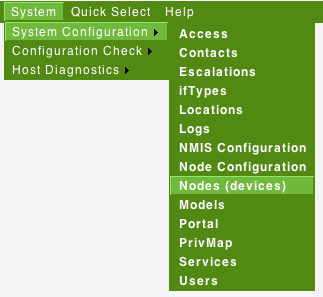
From the NMIS Menu, navigate to "System -> System Configuration -> Nodes (devices)"
From the list of nodes, select "edit" from the server you want to monitor services on.

From the services box, select the services you want to monitor, you can select several services.
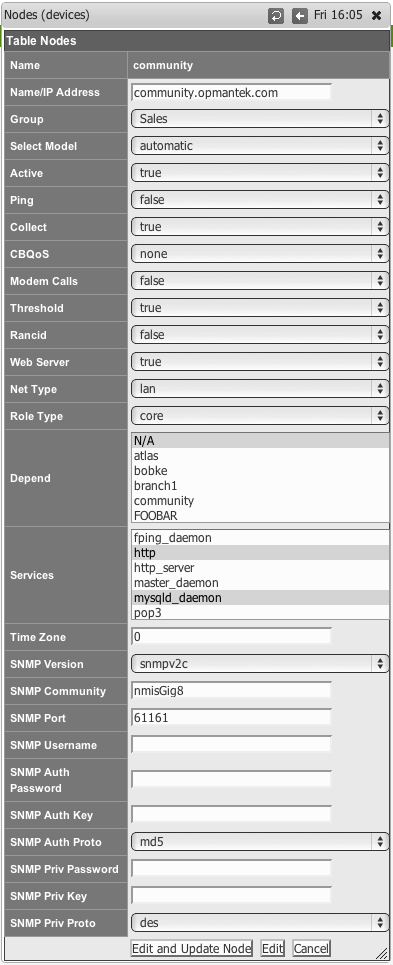
When you are done, select "Edit and Update Node", after the next poll cycle runs, within about 5 minutes you will see that the services are now being monitored
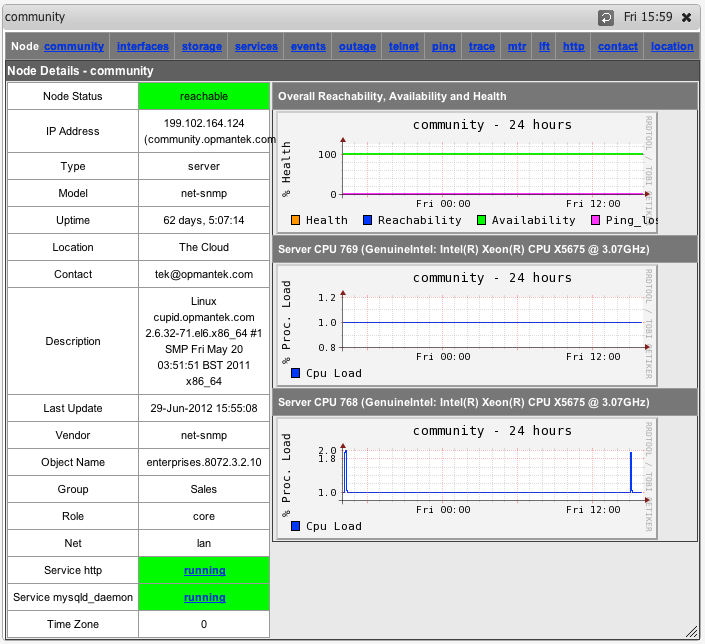
You can also now select "Services" from the node menu bar and see a graph of all the monitored services.
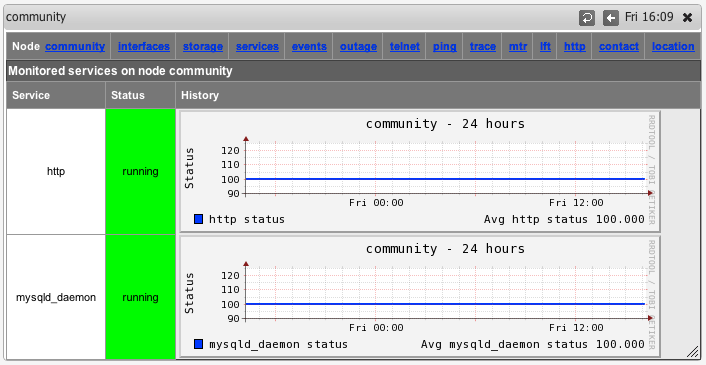
Starting with version 8.4.10G the service graphs also include the response time (as number and and graph) which is the elapsed time of the service test.
This is how to define a new services based on using SNMP for the status of the service.
Determine the name of the service process you want to monitor, for example to Monitor MongoDB on Windows, the process name is mongod.exe. As the MongoDB server state is reported as an attribute for the named process, you'll have to tell NMIS what process to look for.
From the NMIS Menu, navigate to "System -> System Configuration -> Services"
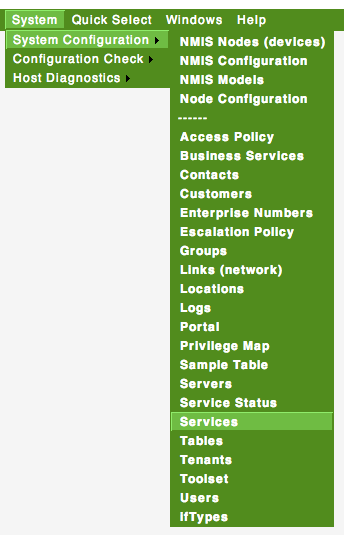
Then select add or edit to add a new service or edit an existing service monitoring definition.

Give the service a (display) name, for Windows we call them service and for Unix we call them daemons. Insert the appropriate process name in the Service Name field, and select the Service Type service to tell NMIS that this is an SNMP-monitored service.
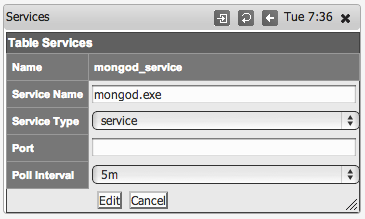
Click "Add" or "Edit" to save the new service and then you can assign this to a device as described above in "Configuring NMIS Services to Monitor".
Assuming you only want to check if a server listens for network connections on a particular TCP or UDP port (without actually exchanging application-level data with that service), then this is how to instruct NMIS to do that:
portudp:123 (that would be NTP) or tcp:22 (that's SSH)Please note that the open/reachable/closed status for UDP ports is unreliable due to the nature of the protocol; doing end-to-end service-specific tests is recommended for UDP.
NMIS also supports monitoring of DNS servers out of the box:
dns.This is how to define a new services based on using a sapi script to connect to the socket and send some data, looking for the correct response.
Sapi scripts are extremely similar to expect scripts and documented at the end of /usr/local/nmis8/lib/sapi.pm.
Determine the name of the service you want to monitor, for example to is the NMIS web application running.
Same as above,
From the NMIS Menu, navigate to "System -> System Configuration -> Services"
Then select add or edit to add a new service or edit an existing service monitoring definition.
Give the service a name, in this example nmis, and it is a script and define the port it will be here port 80.
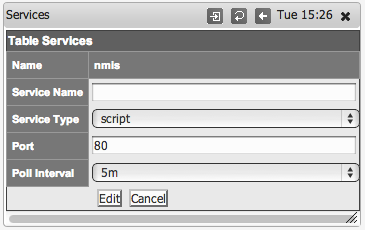
Create a script which will get to the appropriate WEB Application URL, use the basic http service as a basis, the name of the service will be the name of the script
cp /usr/local/nmis8/conf/scripts/http /usr/local/nmis8/conf/scripts/nmis |
Then edit that script and change the script to get your URL correctly, in this example the final nmis script looked like this:
send: HEAD /nmis8/ HTTP/1.0 send: expect: 200 OK |
So this script will connect to port 80, send the "HEAD /nmis8/ HTTP/1.0" and a newline, the most basic if HTTP Headers, the response it would get would be:
HTTP/1.1 200 OK Date: Tue, 01 Apr 2014 05:19:19 GMT Server: Apache/2.2.15 (CentOS) Last-Modified: Thu, 21 Mar 2013 05:14:21 GMT ETag: "a233b-67c-4d8686950cd27" Accept-Ranges: bytes Content-Length: 1660 Vary: Accept-Encoding Connection: close Content-Type: text/html; charset=UTF-8 |
The expect would match the data "200 OK" and declare success. More complex requests could be made here. E.g. checking a database status using HTTP.
Starting with version 8.4.10G nmis can also run external programs to test a service status. To interoperate with NMIS such a program must conform to a few simple rules which are described below.
The steps for enabling this facility are mostly the same as for the other service types, except for the service definition of course. The dialog for Adding or Editing Services now shows some extra options:
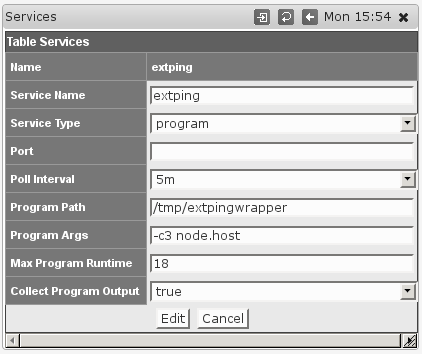
Choosing the Service Type program activates the options for running external programs; they are ignored for all other Service Types.
/). This setting is clearly mandatory, and the program in question must be directly executable by the nmis user.node.something will be replaced by the corresponding property of this node; most likely you will want to use node.host for the node's dns name or network address, node.name for the logical node name, maybe even node.sysContact. To determine the available properties check the 'system' section of /usr/local/nmis8/var/yournode-node.nmis.The external program must follow these interfacing rules to work with NMIS:
key=value pairs on stdout, one pair per line.responsetime is special: any numeric value given for it will be used directly in the service and service response time graphs.Monitoing services with an external program in this fashion is easy to implement, but limited in functionality; if you require access to all the advanced event management and alerting features of NMIS for a service then we recommend that you extend your snmpd for this service instead of using the external program facility.