1
0
-1
1 answer
- 210
Hi Fredrik,
It seems that the NMIS workers should be increased. You can do this in the nmis9 Configuration file, in nmis9/conf/Config.nmis with the following parameter:
'nmisd_max_workers' => 10,
After the change, you should restart nmis9 daemon, nmis9d.
Regards,
- Fredrik Karlsson
So I went from 10 to 100 and now I start wondering how many workers should I have? 4x the cores?
I will let it stabilize for a few hours

- Fredrik Karlsson
It did not help, but I'm removing all devices and re-adding them to clear all jobs.

- Fredrik Karlsson
I increased the worker count to 100 and after I deleted all devices it worked. I had alot of jobs that took over 15 min to clear each. Thanks for the help!
- Josune Cordoba
Thanks for let us know!
For more detailed options with schedule, you can have a look at NMIS 9 Administration Notes
Regards,
Add your comment...
My Metrics graph does not update and the Networks Metrics graph is empty. I have around 2600 routers and switches with around 13000 ports for collection (ports without # in description)
My NMIS server has 56 cores and over 250GB memory and cpu load average is less than 2 percent. I have set up every 5min ping and SNMP collection every 15min.
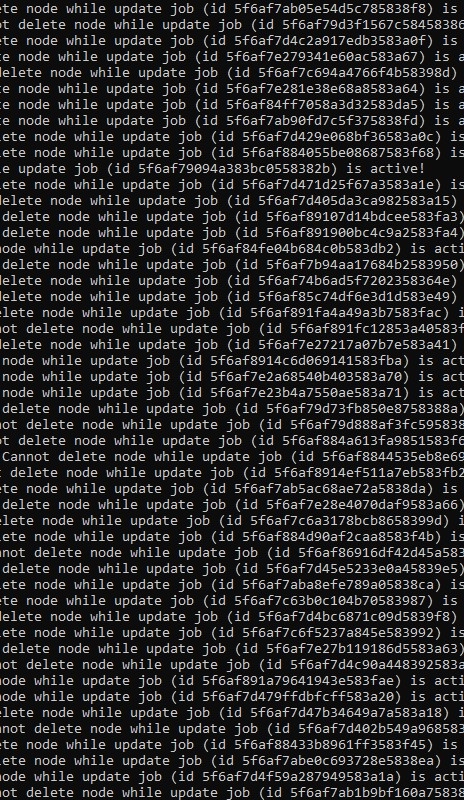
I dont get why there are so many overdue jobs. I have installed NMIS9 with default options.
Can I do anything to increase the amount of active jobs and get the Metrics graph to start updating?