Grouped Availability Report
New in version 3.1.4.
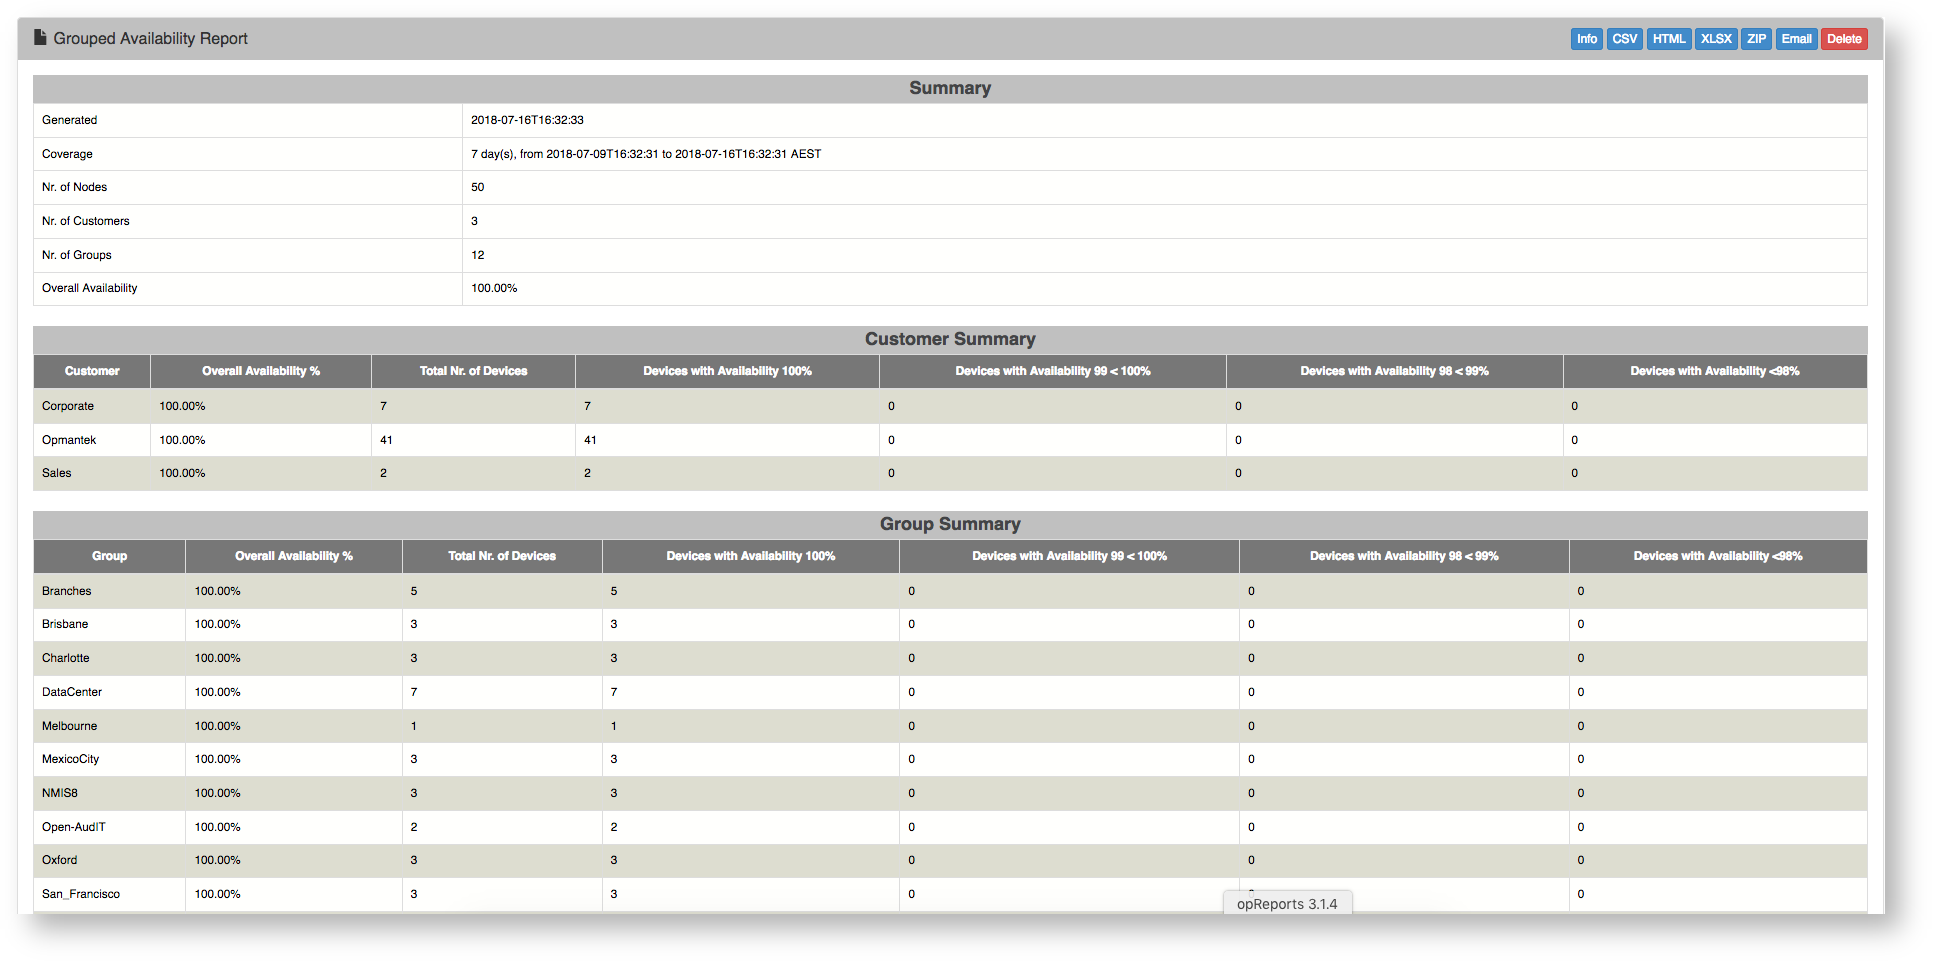
The Grouped Availability Report computes reachability statistics similar to the Node Availability Report, but devices are then categorised based on their overall availability metric; the report shows these results spread over various summary table sections (for HTML output) or work sheets (for XLSX output). Both business days and business hour filtering are supported. The availability categories can be configured flexibly.
A combined total availability metric for all nodes is computed and presented in a summary section, and similar metrics and categorisation device counts for both grouping by Customer and Group (ie. NMIS configuration properties customer and group) are computed and presented. Finally the detailed availability stats are shown for all devices, in order of the devices' group memberships. Instead of determining the individual device availability as the Node Availability Report does, the Grouped Availability Report will calculate and give a summary of the overall availability of all the devices within a specific group as well as display the number of devices within that group. The Grouped Availability Report also displays the Down%, Packet Loss %, No Data %, Uptime, and Downtime for a quick look at overall network health.
A full example of a Grouped Availability Report with default settings can be downloaded and viewed HERE

The Grouped Availability Report can be configured flexibly by adjusting the threshold settings of report_groupedavailability_levels in /usr/local/omk/conf/opCommon.nmis
'report_groupedavailability_levels' => {
      'default' => {
        'good' => {
          'color' => '',
          'description' => '100%',
          'threshold' => 100
        },
        'high' => {
          'color' => '#ffff00',
          'description' => '99 < 100%',
          'threshold' => 99
        },
        'low' => {
          'color' => '#ff8900',
          'description' => '98 < 99%',
          'threshold' => 98
        },
        'lowest' => {
          'color' => '#ff0000',
          'description' => '<98%',
          'threshold' => -1
		}
      }
    },