WAN Utilisation Distribution Report
New in version 3.1.8.
The WAN Utilisation Distribution Report displays the combined, input and output utilisation frequency distributions for configured distribution groups.
The WAN Utilisation Distribution Summary Report displays only the combined utilisation frequency distribution for configured distribution groups.
Setup:
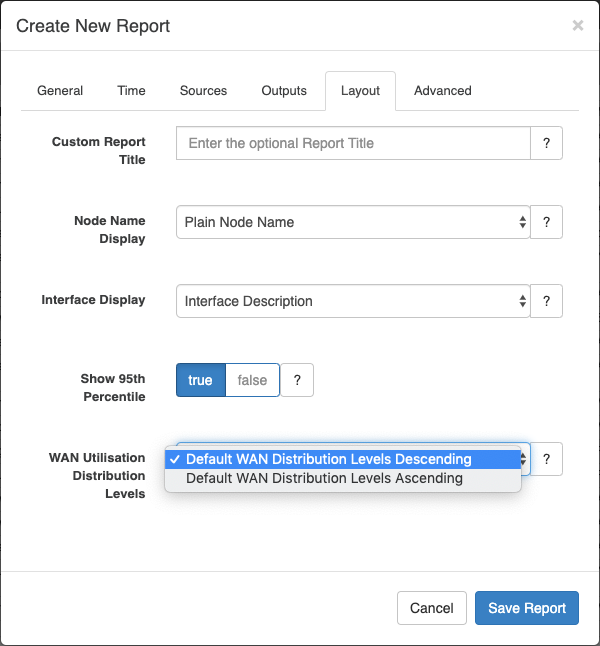
Choose the relevant WAN Utilisation Distribution Report option under Create New Report >> General >> Type:
Choose whether to Show 95th Percentile and choose the desired WAN Utilisation Distribution Levels under Create New Report >> Layout:
Customized WAN Utilisation Distribution Levels:
Two default configured distribution groups are provided: Default WAN Distribution Levels Descending and Default WAN Distribution Levels Ascending.
...
| Code Block |
|---|
'report_wan_distributions' => {
  'Default WAN Distribution Levels Descending' => {
    "group4" =>{
      "description" => "<=30%",
      "min" => 0,
      "max" => 30,
    },
    "group3" => {
      "description" => ">30% <=70%",
      "min" => 30,
      "max" => 70,
    },
    "group2" =>{
      "description" => ">70% <=90%",
      "min" => 70,
      "max" => 90,
    },
    "group1" => {
      "description" => ">90%",
      "min" => 90,
      "max" => 1000000,
    },
  },
  'Default WAN Distribution Levels Ascending' => {
    "group1" =>{
      "description" => "<=30%",
      "min" => 0,
      "max" => 30,
    },
    "group2" => {
      "description" => ">30% <=70%",
      "min" => 30,
      "max" => 70,
    },
    "group3" =>{
      "description" => ">70% <=90%",
      "min" => 70,
      "max" => 90,
    },
    "group4" => {
      "description" => ">90%",
      "min" => 90,
      "max" => 1000000,
    },
  },
} |
Technical Notes:
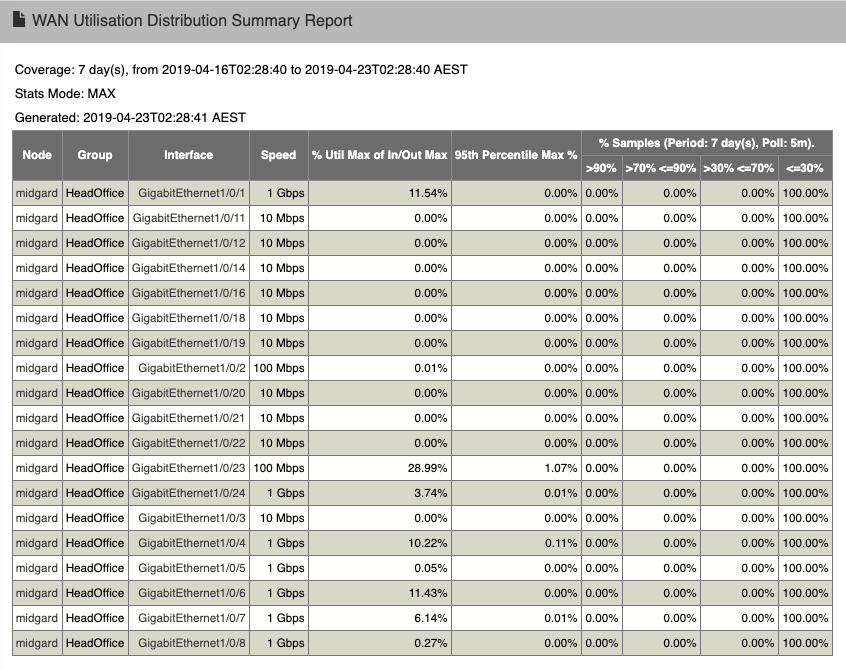
% Util Max of In/Out Max column is calculated from the maximum, not the average, of combined 'in and out' MAXIMUM utilisation.
95th Percentile Max % column is calculated from the maximum, not the average, of combined 'in and out' 95th percentile utilisation.
Example:
Here is an example screenshot of a WAN Utilisation Distribution Summary Report with Show 95th Percentile selected and using the Default WAN Distribution Levels Descending default configured distribution group:
 Link:
Link:
Related Topics
...