This page is to help explain what information is being displayed in an opFlow chart over a period of time. Using the example below we can see the flow summary of an agent, in this case it is a router named gc-router1. We are collecting flow information sent Out on the interface named FastEthernet0/0: Opmantek LAN. If you would like to view flow information coming In instead, change this option to In after selecting the agent and interface to monitor.
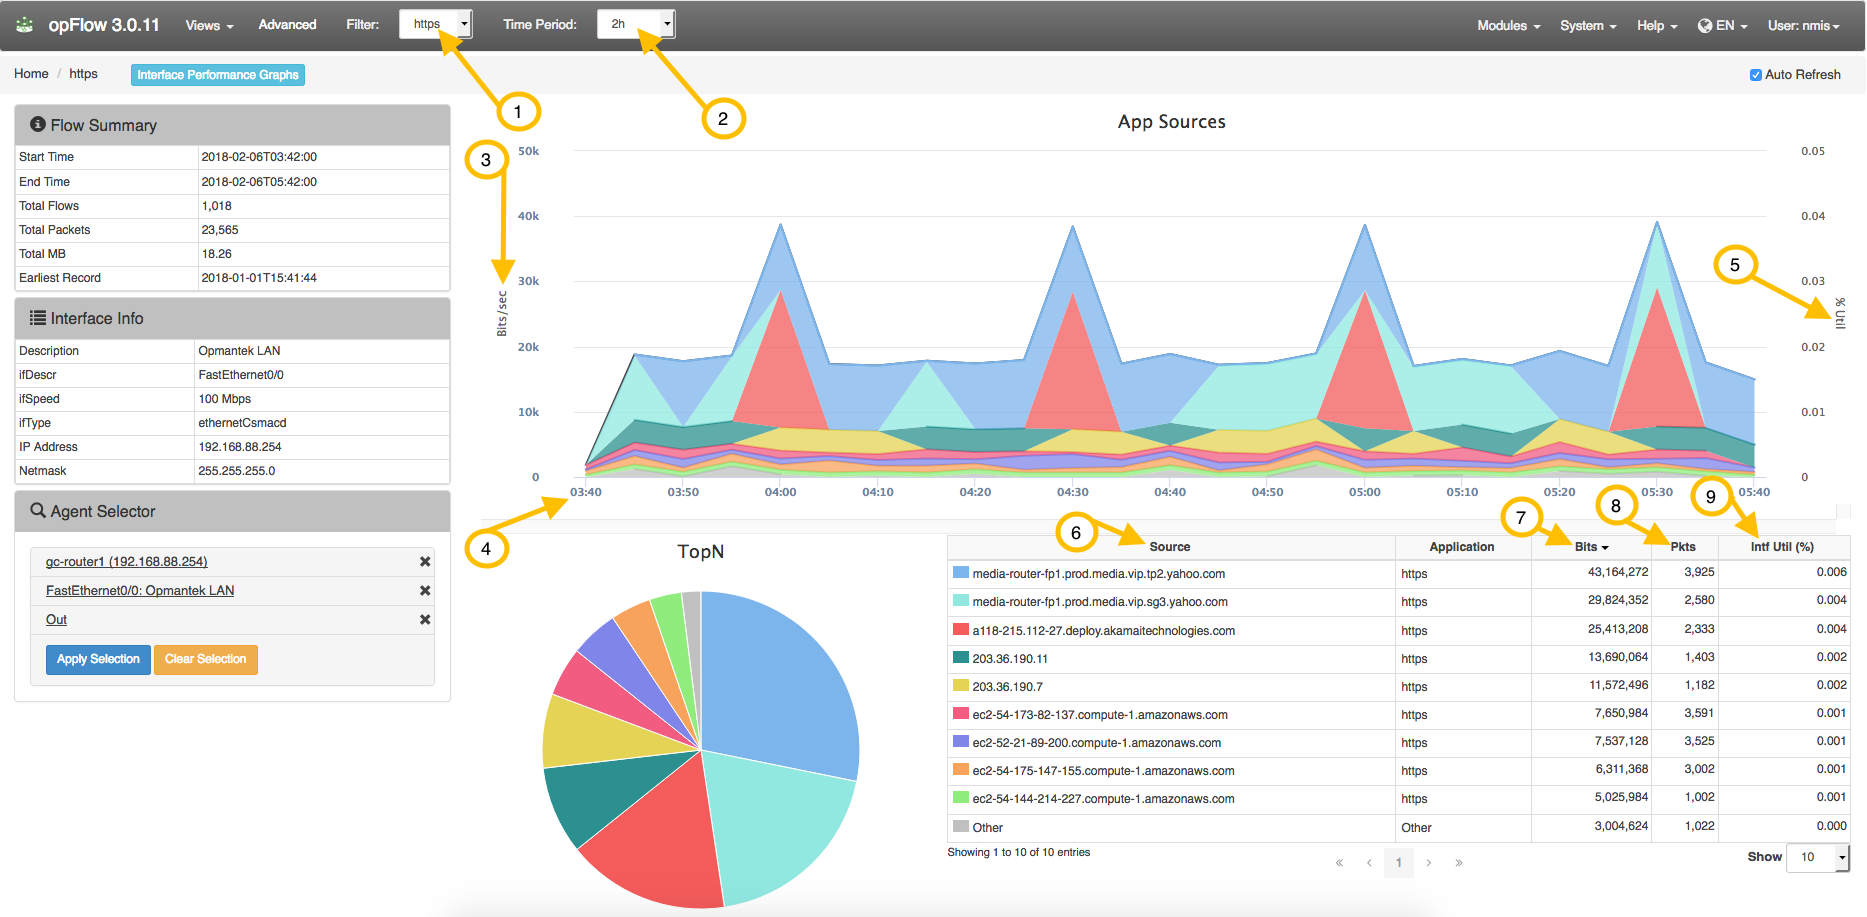
A brief description of key items to help in understanding opFlow information:
| Variable | Description |
|---|---|
| (1) Filter | Applies or removes the HTTPS filter to the chart. |
| (2) Time Period | Select the time period for the chart. (15m - 2d) |
| (3) Bits/Sec | Information displayed in bits per second. This can also be displayed in Flows/sec and Packets/sec (Advanced) |
| (4) Time | Start time defined by Time Period filter. |
| (5) %Util | Percent utilization. |
(6) Source | The source of captured flows. |
| (7) Bits | Total bits sent out from the source over the selected Time Period. |
| (8) Pkts | Total packets sent out from the source over the selected Time Period. |
| (9) Intf Util (%) | Displays the interface utilization percentage of each source. |
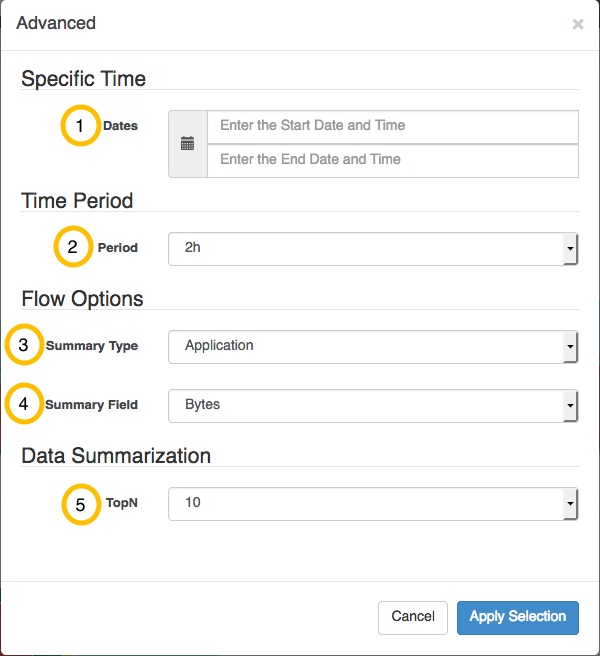
The advanced menu gives more options for viewing flow information:
| Variable | Description |
|---|---|
| (1) Start/End Date and Time | Select custom Start/End Date and Time. |
(2) Period | Select the time period for the chart. (15m - 2d) |
| (3) Summary Type | Type of chart information displayed. (Applications, App Sources, App Destinations, Conversations by Application, Listeners, Talkers) |
| (4) Summary Field | Type of chart information displayed. (Bytes, Flows, Packets) |
| (5) TopN | The number of TopN items displayed. |