When a network breach is detected you need to take action, you don't have time to look over terabytes of packet data. You and your team need know when and where the incident occurred. NetFlow data provides valuable information about all network activity, this data can be very useful for incident response and can help you detect if your network has been compromised. opFlow is well equipped to read and organize flow data to help you quickly understand when breaches occur and where to take action.
When logging into opFlow the default landing page is the Top 10 App Sources. This page displays information in a visually pleasing way notifying you of the top application/sources of flow data. You may be able to detect a breach simply by noticing an unusual or unrecognized application/source on this page. However, there is a much more detailed way in detecting a breach.
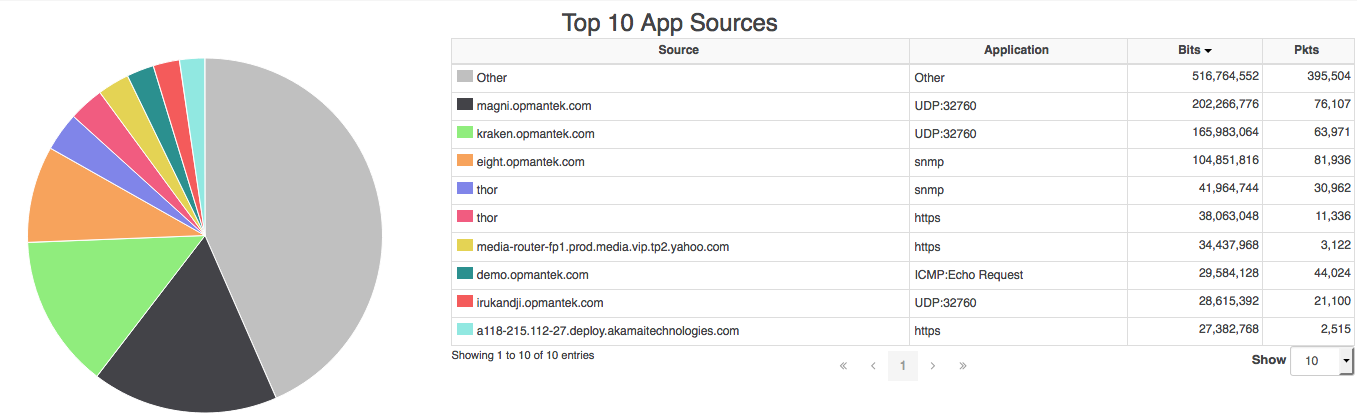
Figure 1 - Top 10 App Sources
In opFlow, navigate to menu -> Views -> TopN. The TopN feature can display the top Applications, Top Application Sources, Top Application Conversations, Top Listeners, Top Protocols, Top Talkers, and Top TOS. Select the Top Application Conversations and you will see what device or interface is sending and receiving the most packets. For example, in Figure 2 below flow data captured the Source, Destination, Application, Port, as well as the number of Flows and Packets. Using this information it would be easy to identify a DoS attack on your network by identifying unusually high numbers of Flows/Packets being sent from an untrusted source.
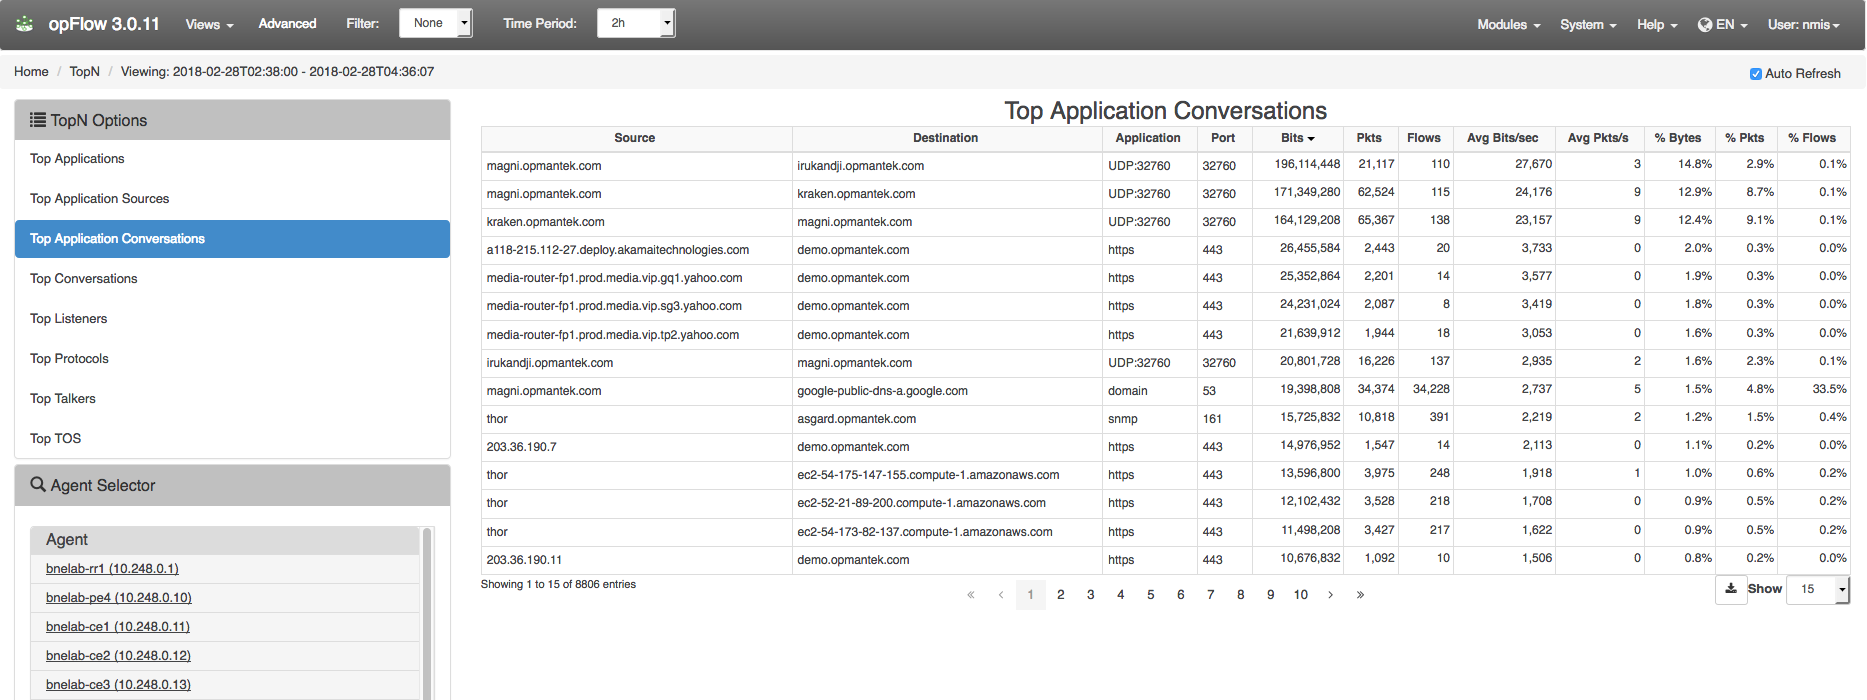
Figure 2 - Top Application Conversations