Response Time Report
The Response Time report tabulates the selected nodes in descending order of their average response time. Besides the average and maximum measurements, the report also shows the 95th percentile of the response time. These readings are in milliseconds.
Response Time Exceptions
This column shows the number of times a device's response time has exceeded the exception threshold during the reporting period. This threshold is configurable (property response_exception_threshold), and its default value is 10 ms.
A full example of a Response Report can be downloaded and viewed Here
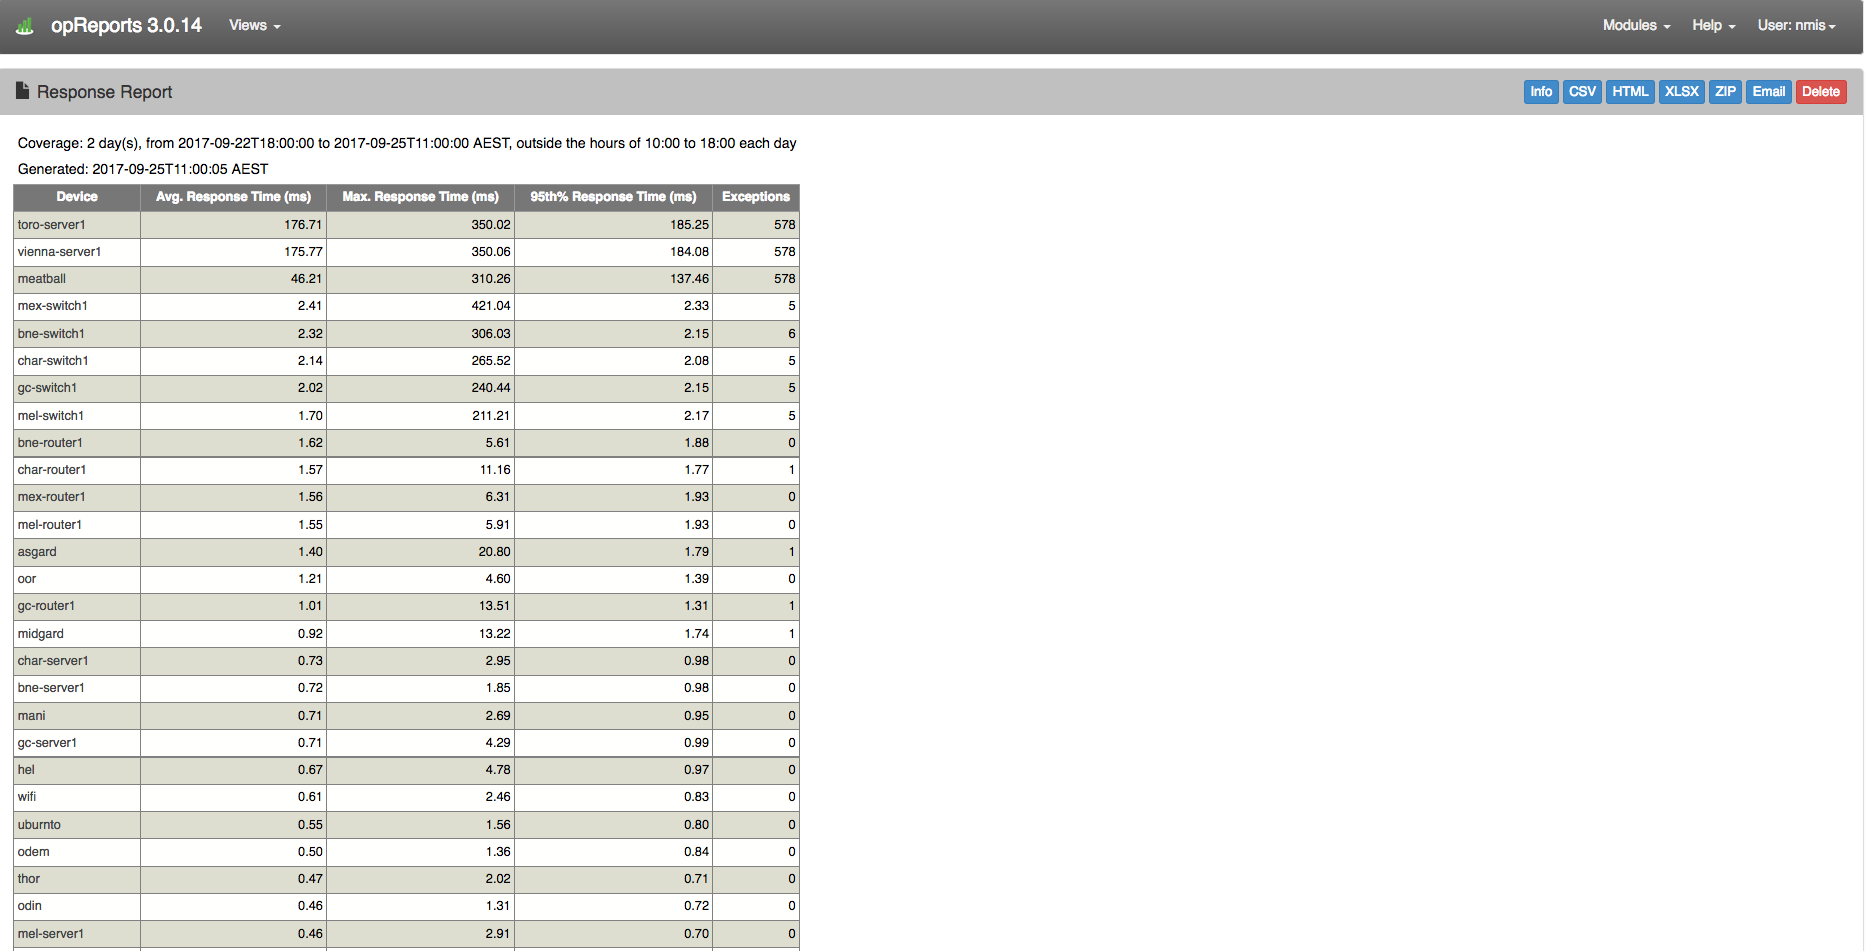
Example Response Report: