Why we need a Dynamic Baseline and Thresholding Tool
Forewarned is forearmed the poverb goes, a quick google tells me "prior knowledge of possible dangers or problems gives one a tactical advantage". The reason we want to baseline and threshold our data is so that we can receive alerts forewarning us of issues in our environment, so that we can act to resolve smaller issues before they become bigger. Being proactive increases our Mean Time Between Failure.
If you are interested in accessing the Dynamic Baseline and Thresholding Tool, please Contact Us.
Types of Metrics
When analysing time series data you quickly start to identify a common trend in what you are seeing, you will find some metrics you are monitoring will be "stable" that is they will have very repeated patterns and change in a similar way over time, while other metrics will be more chaotic, with a discernible pattern difficult to identify.
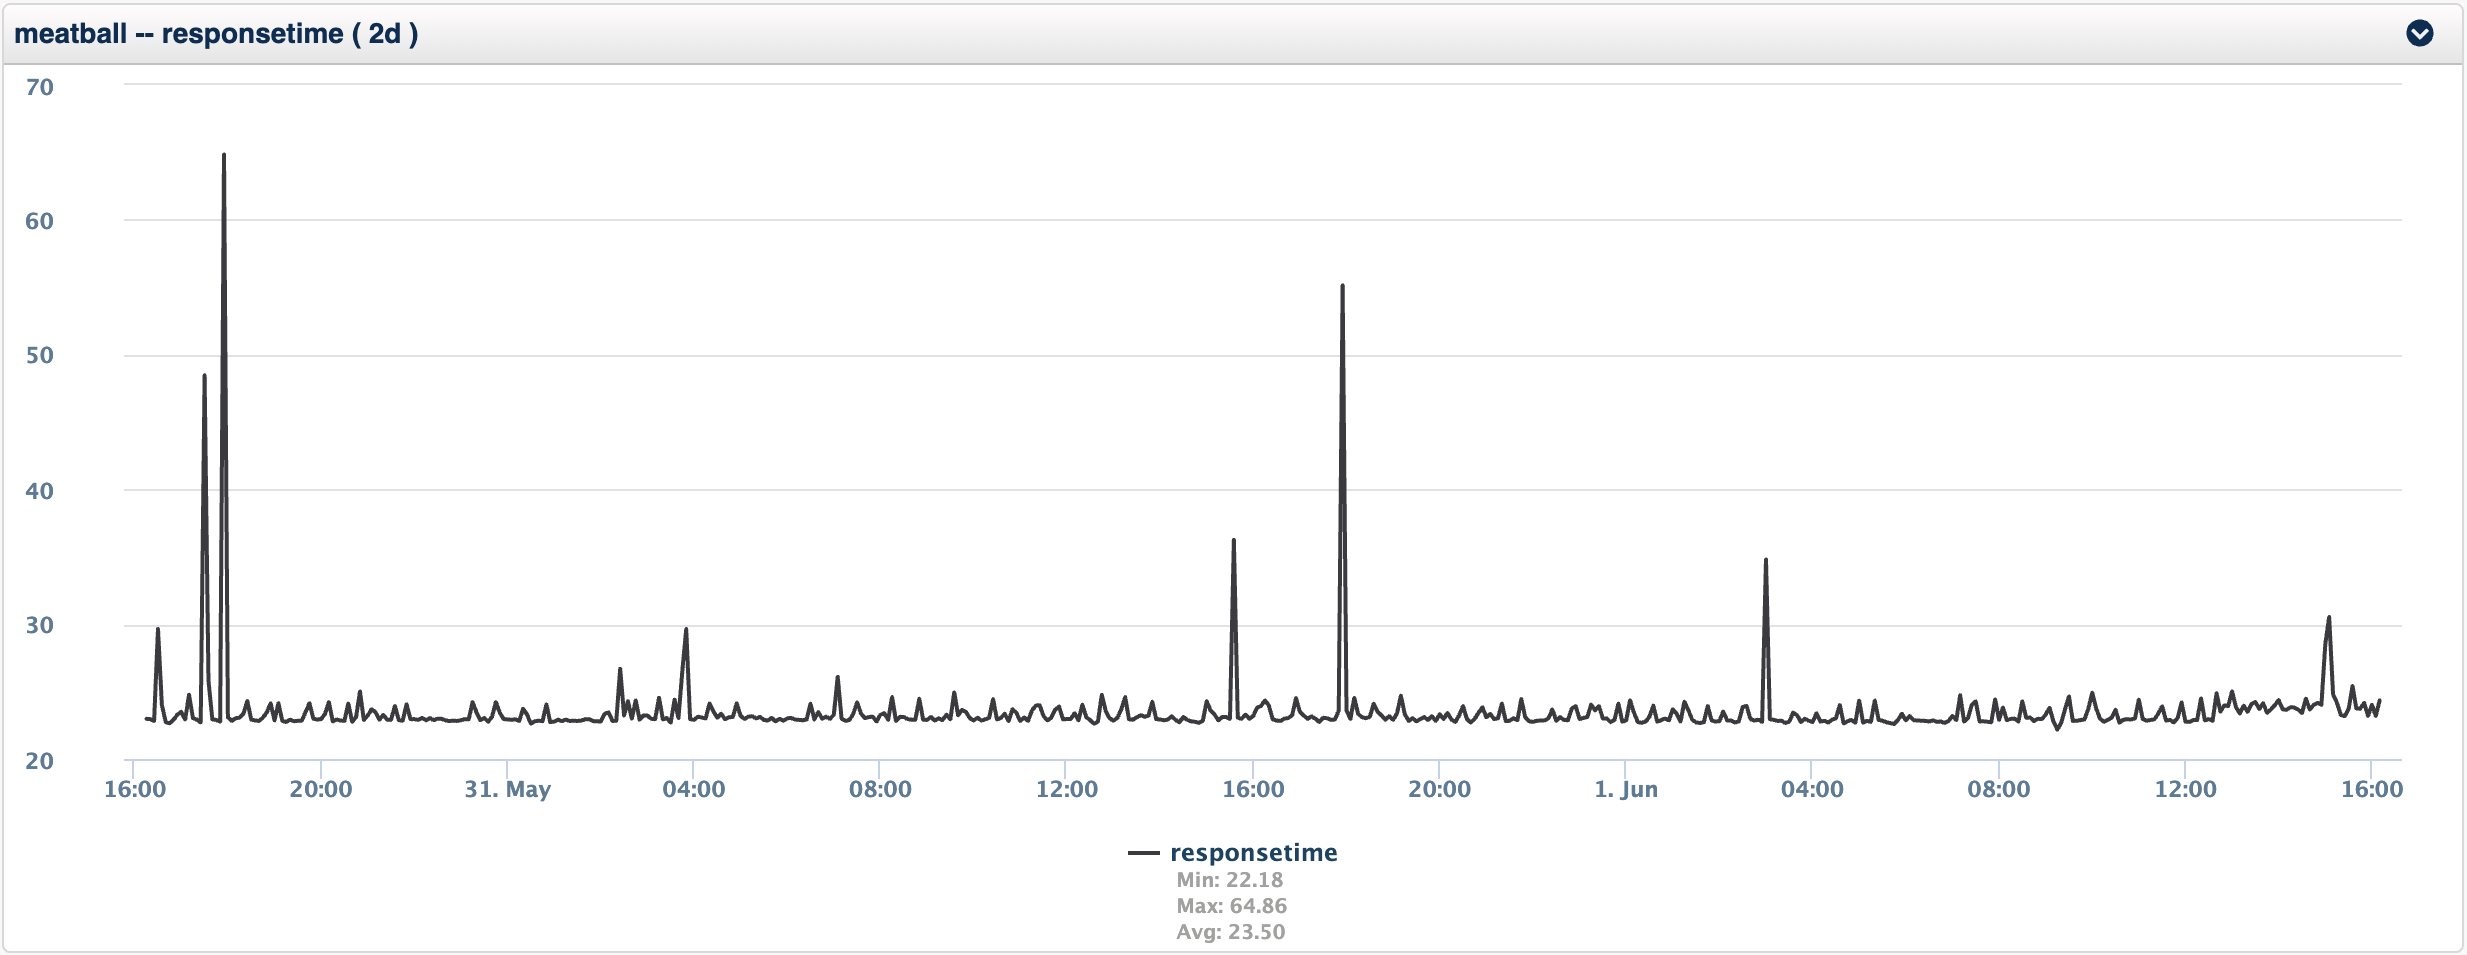
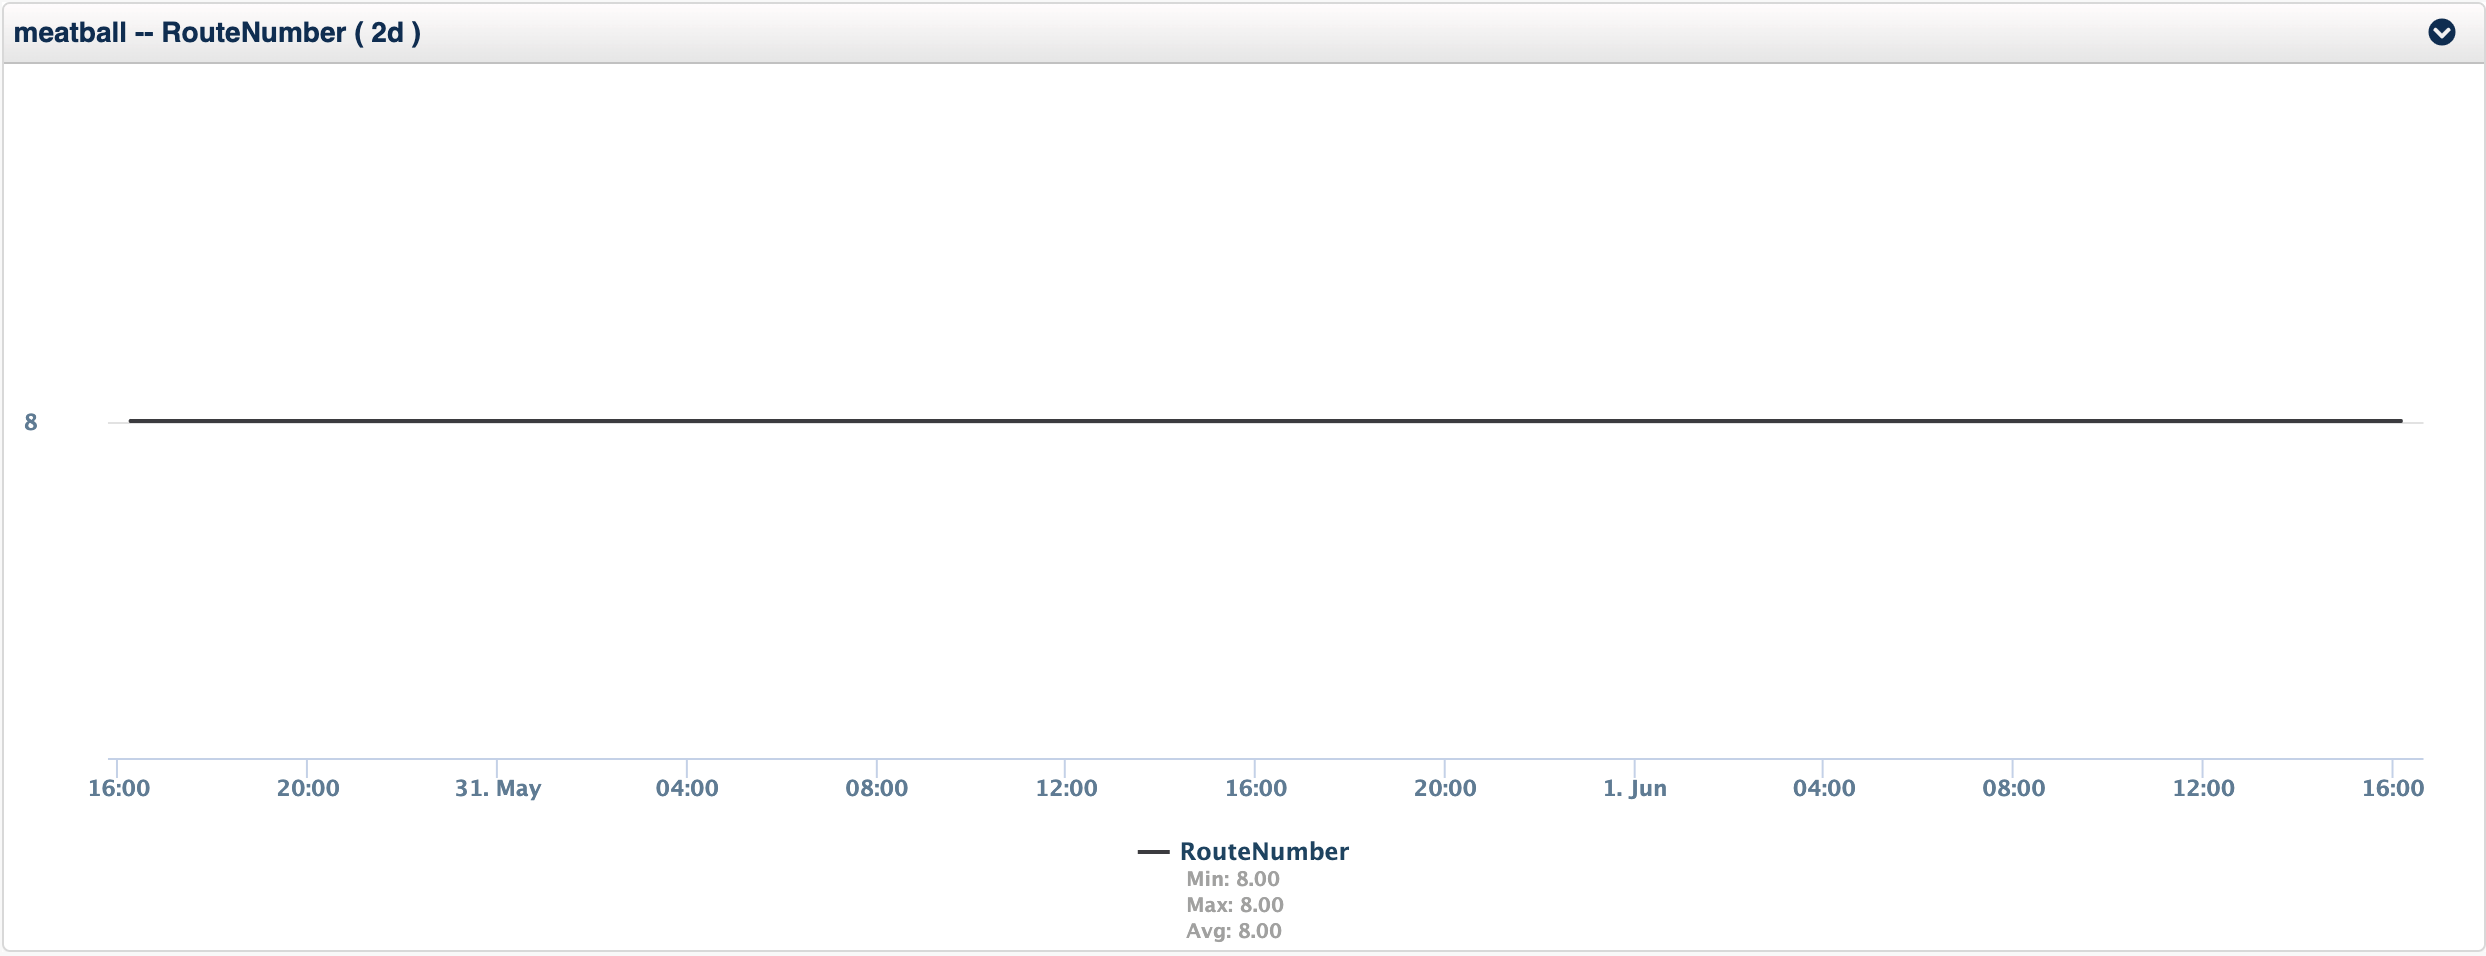
Take for example two metrics, response time and route number (the number of routes in the routing table), you can see from the charts below that the response time is more chaotic with some pattern but really little stability in the metric, while the route number metric is solid, unwavering.
Comparing Metrics with Themselves
This router meatball is a small office router, with little variation in the routing, however a WAN distribution router would be generally stable, but it would have a little more variability. How could I get an alarm from either of these without configuring some complex static thresholds?
The answer is to baseline the metric as it is and compare your current value against the baseline, this method is very useful for values which are very different on different devices, but you want to know when the metric changes, example are route number, number of users logged in, number of processes running on Linux, response time in general, but especially response time of a service.
The opTrend Dynamic Baseline and Threshold Tool
Overall this is what opTrend does. The sophisticated statistical model it builds is very powerful and helps spots these trends with the baseline tool. We have extended opTrend with some additional functionality so that you can quickly get alerts from metrics which are important to you.
What is really key here is that the baseline tool will detect downward changes as well as upward changes, so if your traffic was reducing outside the baseline you would be alerted.
Establishing a Baseline
Current Value
Firstly I want to calculate my current value, I could use the last value collected, but depending on the stability of the metric this might cause false positives, as NMIS has always supported, using a larger threshold period when calculating the current value can result in more relevant results.
For very stable metrics using a small threshold period is no problem, but for wilder values, a longer period is advised. For response time alerting, using a threshold period of 15 minutes or greater would be a good idea. That means that there is some sustained issue and not just a one off internet blip. However with our route number we might be very happy to use the last value and get warned sooner.
Multi-Day Baseline
Currently two types of baselines are supported by the baseline tool, the first is what I would call opTrend Lite, which is based on the work of Igor Trubin's SEDS and SEDS lite, this methods calculates the average value for a small window of time looking back the configured number of weeks, so if my baseline was 1 hour for the last 4 weeks and the time now is 16:40 on 1 June 2020 it would look back and gather the following:
- Week 1: 15:40 to 16:40 on 25 May 2020
- Week 2: 15:40 to 16:40 on 18 May 2020
- Week 3: 15:40 to 16:40 on 11 May 2020
- Week 4: 15:40 to 16:40 on 4 May 2020
With the average of each of these windows of time calculated, I can now build my baseline and compare my current value against that baseline's value.
Same-Day Baseline
Depending on the stability of the metric it might be preferable to use the data from that day. For example if you had a rising and falling value It might be preferable to use just the last 4 to 8 hours of the day for your baseline. Take this interface traffic as an example, the input rate while the output rate is stable with a sudden plateau and is then stable again.
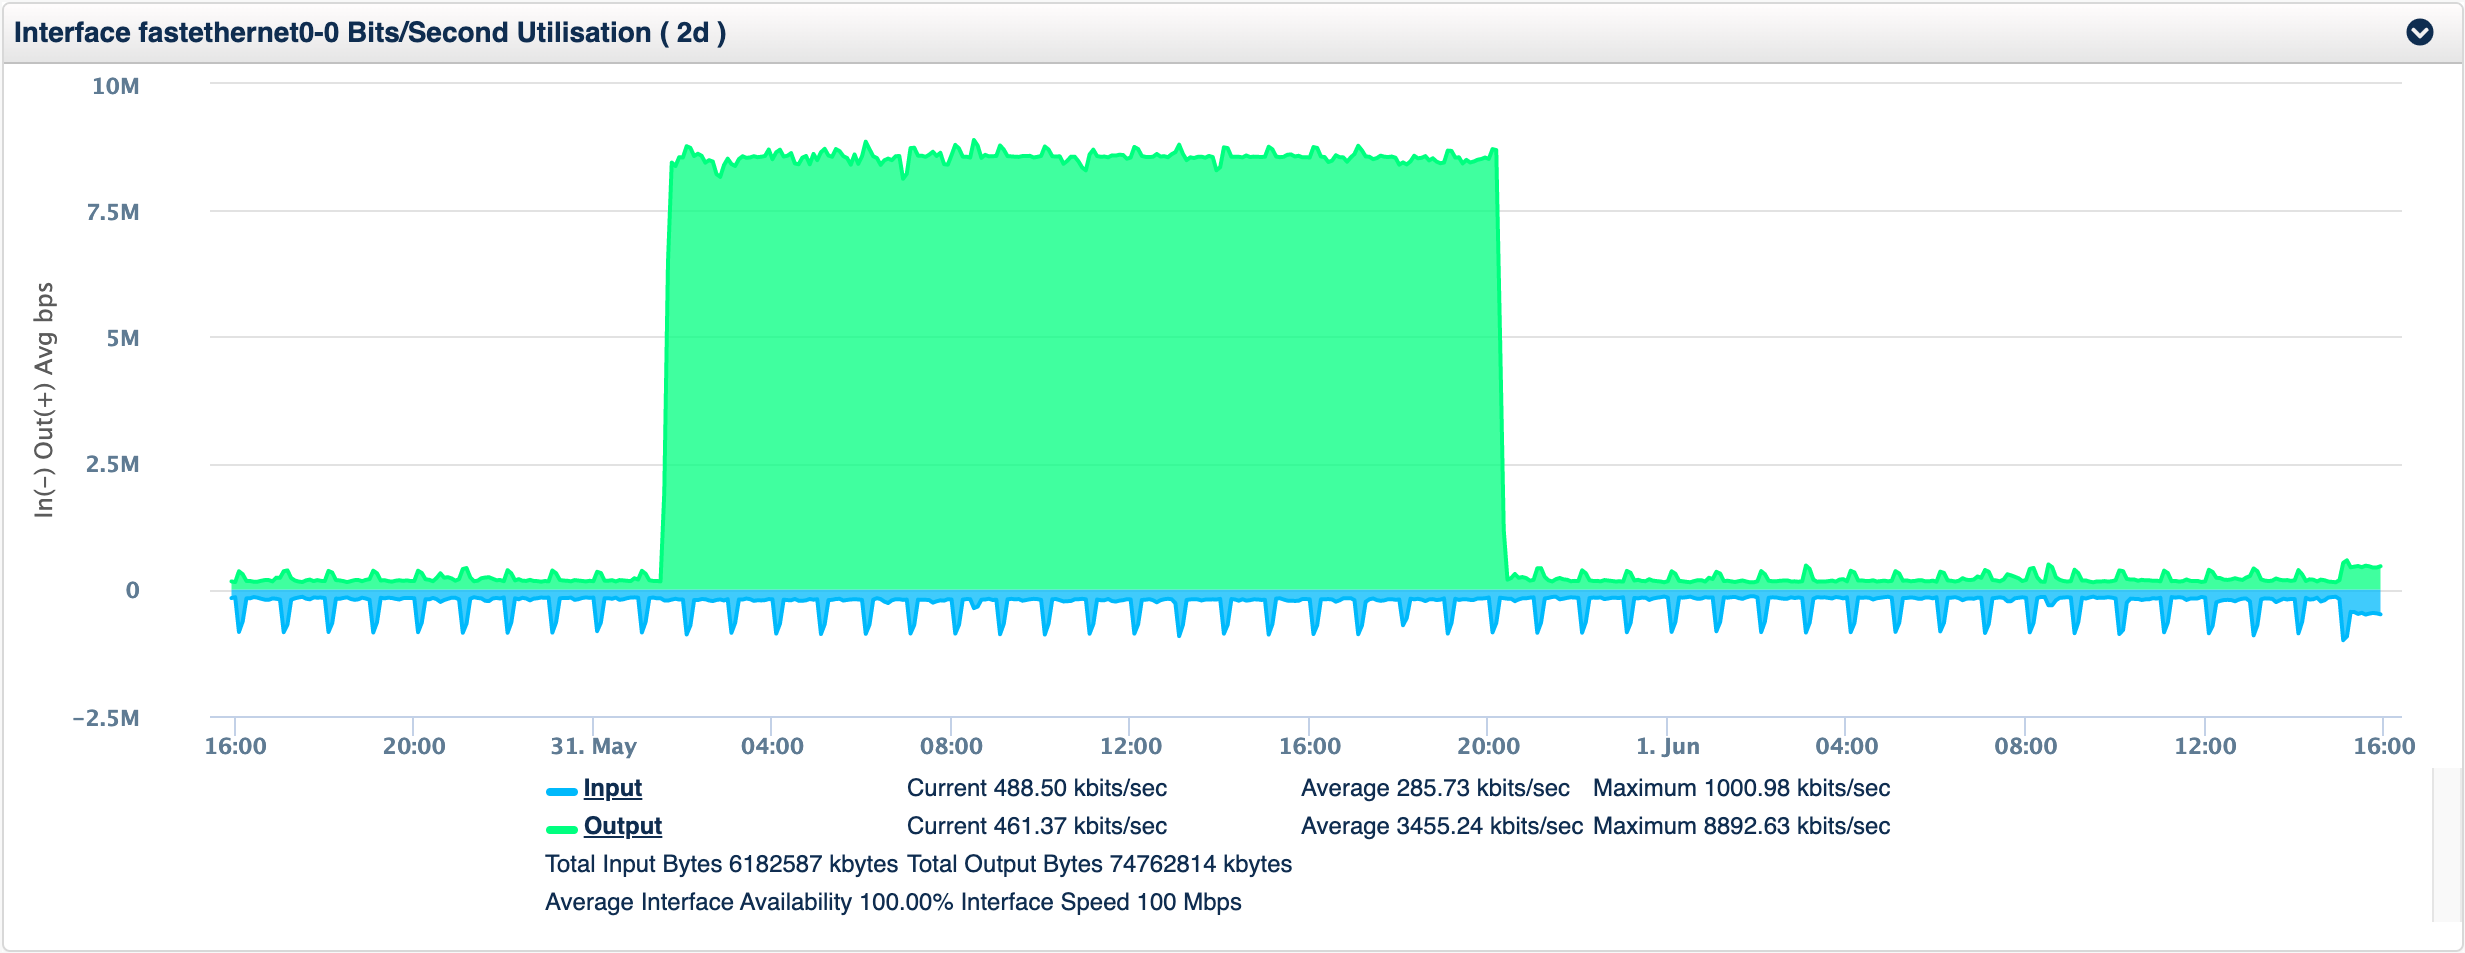
If this was a weekly pattern the multi-day baseline would be a better option, but if this happens more randomly, using the same-day would generate an initial event on the increase, then the event would clear as the ~8Mbps became normal, and then when the value dropped again another alert would be generated.
Working with the Dynamic Baseline and Thresholding Tool
The Dynamic Baseline and Threshold Tool includes various configuration options so that you can tune the algorithm to learn differently depending on the metric being used. The tool comes with several metrics already configured. It is a requirement of the system that the stats modelling is completed for the metric you require to be baseline, this is how the NMIS API extracts statistical from the performance database.
Dynamic Baseline Configuration Options
Configuration of the baseline tool is done in the file /usr/local/omk/conf/Baseline.nmis the default configuration should be installed when the tool is installed.
| Configuration Option | Description | Example |
|---|---|---|
| active | Is baselining this metric active or not, values are true or false | true |
| metric | Which NMIS datapoint or variable, equates to an RRD DS | RouteNumber |
| type | Which NMIS model section or metric | RouteNumber |
| section | What is the section name in the node info, just run it, otherwise the section must exist. | |
| nodeModel | This is a regex which defines which NMIS models should be matched | CiscoRouter |
| event | The name of the event to use, will default to Proactive Baseline type metric if none provided. | Proactive Route Number Change |
| indexed | Is this variable indexed or not | false |
| threshold_exceeds | Ignored if undef otherwise the value must ALSO exceed this threshold to raise an event | undef |
| threshold_period | How many minutes should the value to be baselined be averaged, e.g. -5 minutes is the last poll, -15 minutes would be the average of the last 15 minutes, -1 hour would be the last 60 minutes. | -5 minutes |
| multiplier | How many standard deviations to vary the baseline by. | 1 |
| weeks | The number of weeks to look back | 0 |
| hours | The number of hours to include in the baseline metrics | 8 |
Here is what the configuration file would look like, this example is a Same-Day Baseline:
  'RouteNumber' => {
    'active' => 'true',
    'metric' => 'RouteNumber',
    'type' => 'RouteNumber',
    'nodeModel' => 'CiscoRouter',
    'event' => 'Proactive Route Number Change',
    'indexed' => 'false',
    'threshold_exceeds' => undef,
    'threshold_period' => "-5 minutes",
    'multiplier' => 1,
    'weeks' => 0,
    'hours' => 8,
  },
Another configuration option using the BGP Prefixes being exchanged with BGP peers, is from systemHealth modelling and this is a multi-day baseline:
  'cbgpAcceptedPrefix' => {
    'active' => 'true',
    'metric' => 'cbgpAcceptedPrefix',
    'type' => 'bgpPrefix',
    'section' => 'bgpPrefix',
    'nodeModel' => 'CircuitMonitor|CiscoRouter',
    'event' => 'Proactive BGP Peer Prefix Change',
    'indexed' => 'true',
    'multiplier' => 1,
    'weeks' => 4,
    'hours' => 1,
  },
Running the Baseline Tool
After it is installed the tool will be run from cron automatically, you can run it interactively using the following command:
/usr/local/omk/bin/baseline.pl act=run
There are some debug options to see a little more detail, debug=true, debug=2 or debug=3 are the current levels of verbosity.
Additional options will be added, running the tool with no arguments will tell you the currently supported options.