opFlow Dashboard is Bare (graphs show no data)
It appears that you are not receiving any flows; have you checked when you restarted opFlow? it can take a few minutes to start receiving and processing net flow records.
Besides that there are a few potential causes for problems to examine.
Has the IP address of the opFlow server or virtual machine changed?
If so, change net flow configurations in the network devices to send to new IP address.
Verify that the flow collection daemon is running
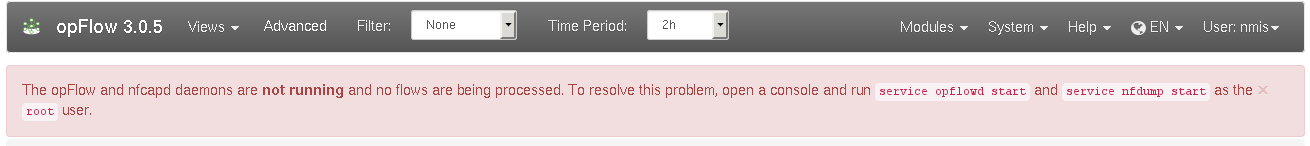
In opFlow 3 you'll be warned of daemon problems on the main dashboard page, similar to the screenshot below:
(opFlow 2) Verify that "flowd" is running
opFlow 2 uses the tool "flowd" to receive (and temporarily store) flow data:
ps -ef | grep flowd
You should see a few entries besides the grep one, the relevant one here being the two "flowd" lines:
[root@thor opmantek]# ps -ef | grep flowd
root 13356 1 0 Jun18 ? 00:00:10 flowd: monitor
_flowd 13357 13356 0 Jun18 ? 00:00:30 flowd: net
root 27114 1 0 12:40 ? 00:00:00 NMIS opflowd debug=0
root 32567 27106 0 12:51 pts/5 00:00:00 grep flowd
To start a missing/dead flowd, simply run sudo service flowd start.
(opFlow 3) Verify that "nfcapd" is running
In opFlow 3, we've switched to a more modern flow collector, "nfcapd" from the "nfdump" package; opFlow 3 also ships with a more convenient init script for this daemon:
sudo service nfdump status
should report that nfcapd is running with a particular pid; you can verify that by following up with ps -ef|fgrep nfcapd.
If no nfcapd is alive, run sudo service nfdump start.
Verify that opFlow's main daemon is running
opFlow requires that its opflowd is running to periodically retrieve and process new flow data from the respective flow collector tool.
sudo service/opflowd status should report a live opFlowd
Start it with the command below
sudo service opflowd start
Verify that MongoDB is running
Without a working MongoDB opFlow can't operate; in all likelihood you will use a local MongoDB server, on the same machine as opFlow.
In this case, sudo service mongod status and/or ps -ef | fgrep mongod should suffice to verify a living mongod server.
(If you are not using the default setup but rather a remote mongod instance, you'll have to use the mongo shell to verify it's reachable and working.)
Like above, starting a missing mongod instance is easy: sudo service mongod start is the command you should use. Please note that mongod may refuse to start for a number of reasons (e.g. misconfiguration, lack of disk space, etc.); if the service start indicates failure you'll have to investigate using the MongoDB logs (which are usually in /var/log/mongodb/).
Check that the data source folder configuration is consistent
opFlowd needs to know where to look for new flow data, and clearly the flow collector tool needs to know where to save data for consumers to find it.
(opFlow 2) flowd directories
Check that all the folders are the same. Run these commands and make sure that everything is pointing to the right spot.
grep logfile /usr/local/etc/flowd.conf
grep opflow_dir /usr/local/opmantek/conf/opFlow.nmis
It is especially important that the logfile which flowd uses is picked up by opFlow which is the "flowd_data" configuration and this is combined with "<opflow_dir>" to get the path.
grep logfile /usr/local/etc/flowd.conf
logfile "/data/opflow/flowd"

grep opflow_dir /usr/local/opmantek/conf/opFlow.nmis
 '<opflow_dir>' => '/data/opflow',
 'flowd_data' => '<opflow_dir>/flowd',
(opFlow 3) nfcapd/nfdump directory
The default configuration for nfcapd uses /var/lib/nfdump for flow data storage, and opFlowd needs to use the same directory.
grep opflow_dir  /usr/local/omk/conf/opCommon.nmis
 '<opflow_dir>' => '/var/lib/nfdump',

cat /etc/default/nfdump /etc/sysconfig/nfdump
#...at most one of these files exists; if not the default in /etc/init.d/nfdump will be used
# in all cases the relevant line looks like this:
DATA_BASE_DIR="/var/lib/nfdump"
Check your diskspace (mainly opFlow 2)
Make sure where ever you are putting the flow data and the Mongo DB, you have quite alot of disk space; Flow data is very voluminous.
In opFlow 3, the database collections are normally "capped" in size and do not grow.
df -h /data
Filesystem Size Used Avail Use% Mounted on
/dev/mapper/vg_data-lv_data
           247G  86G  148G  37% /data
Check Log Files
Review the log files in /usr/local/omk/log.
- opFlow.log
- common.log
- opDaemon.log
Run a purge manually (only opFlow 2)
Purge the raw flow binary flow data and the older database data, this assume you want to keep 7 days of flow binary data and it is located in /var/opflow.
/usr/local/opmantek/bin/opflow_purge_raw_files.sh /var/opflow 7
/usr/local/opmantek/bin/opflowd.pl type=purge
8. Are NetFlow packets arriving at the server?
You have verified that flowd/nfcapd and opflowd are running, but still you have no data on your dashboard. There are several things to check:
(opFlow 2) Check the flowd logfile to make sure it is growing
Find the logfile by checking the flowd.conf file (normally in /usr/local/etc/flowd.conf)
ll /data/opflow/flowd
[root@thor opflow]$ ls -l /data/opflow/flowd
-rw------- 1 root root 4900 Oct  7 10:42 flowd
[root@thor opflow]$ ls -l /data/opflow/flowd
-rw------- 1 root root 6800 Oct  7 10:42 flowd
[root@thor opflow]$ ls -l /data/opflow/flowd
-rw------- 1 root root 7600 Oct  7 10:43 flowd
In this example the file is growing, so flows are making it into the server, if they are not you will see something like this
[root@thor opflow]$ ls -l /data/opflow/flowd
-rw------- 1 root root 0 Feb  7  2013 flowd
[root@thor opflow]$ ls -l /data/opflow/flowd
-rw------- 1 root root 0 Feb  7  2013 flowd
In this case the file is not growing and more investigation is necessary.
(opFlow 3) Check that nfcapd is rotating files, that they're not empty
As per 5, nfcapd stores files normally in /var/lib/nfdump, and rotates them every 120 seconds; opFlowd picks them up and moves them within a few seconds after that.
cd /var/lib/nfdump
ls -l
# ... lots of stuff
drwxrwxr-x   2 nmis nmis 20480 Jun  9 11:31 flows.2016-06-09
drwxrwxr-x   2 nmis nmis  4096 Jun  9 11:33 inprogress
-rw-r--r--   1 root root   276 Jun  9 11:36 nfcapd.current.1417
-rw-r--r--   1 root root 927828 Jun  9 11:35 nfcapd.201606091133
drwxrwxr-x   2 nmis nmis  4096 Mar 17 16:19 overload
You should see a very 'fresh' and likely small file called nfcapd.current.N, and that should be recreated on every rotation cycle - look at the timestamp. If it is not, nfcapd isn't working.
Temporarily you may also see files named nfcapd.YYYYMMDDHHMM; these are flow data files that are ready for opFlowd, but which have not yet been consumed. When opFlow starts analyzing, it'll move the file into the inprogress directory, and when it's done all flow files go into the flows.YYYY-MM-DD directory for archival.
You can also use the nfdump tool to query flow files in very flexible ways (see the nfdump manual page for details):
/usr/local/omk/bin/nfdump -o raw -r nfcapd.201606090829
# prints every flow record in that file, followed by a short statistics section:
Summary: total flows: 1562, total bytes: 1858493, total packets: 7904, avg bps: 7556, avg pps: 4, avg bpp: 235
Time window: 2016-06-09 08:28:23 - 2016-06-09 09:01:10
Total flows processed: 1562, Blocks skipped: 0, Bytes read: 131400
Sys: 0.052s flows/second: 29477.3    Wall: 0.219s flows/second: 7113.2
Are netflow packets sent where they are expected?
There is no strict standard for which (UDP) port netflow exporters and collectors should use.
The default flowd configuration shipped with opFlow 2 used port 12345.
The nfdump/nfcapd configuration shipped with opFlow 3 uses the more common/modern port 9995.
Clearly your exporting devices need to be configured to use the appproriate target port.
Checking for packets arriving at the server
Running tcpdump will tell us if packets are making it to the server at all:
# change/verify the interface (eth0) and port (if you have changed from the default config)
# this is for a default opFlow 2/flowd
sudo tcpdump -vni eth0 proto \\udp and port 12345
# this is for a default opFlow 3/nfdump
sudo tcpdump -vni eth0 proto \\udp and port 9995
If no packets are arriving double check the firewall configuration will allow them through:
iptables -L

# seeing something like this means they are, if your output is different it does not mean they cannot make it through, it simply means you will have to take a good look at what your output is telling you
Chain INPUT (policy ACCEPT)
target     prot opt source               destination
Chain FORWARD (policy ACCEPT)
target     prot opt source               destination
Chain OUTPUT (policy ACCEPT)
target     prot opt source               destination
If you see no packets arrive using tcpdump and the firewall is not stopping the packets then you will need to verify the configuration of your node that is sending the netflow packets and that they are going to the correct node/port. One way to check the config on a Cisco device is:
router>sh ip flow export
Flow export v9 is enabled for main cache  Export source and destination details :
  VRF ID : Default
    Destination(1)  192.168.1.7 (12345)
    Destination(2)  192.168.1.42 (12345)
  Version 9 flow records
  25716317 flows exported in 890127 udp datagrams
If that is not the issue you will need to verify that nothing on your network is filtering the packets and preventing them from arriving at the server.
Determining where (unexpected/undesirable) flows are coming from
opFlow 2
To figure out where all the flows / conversations in your DB are coming from you can look at the agents list.
In opFlow 2.5 and below the agents list is only populated from flow data and not from conversations. The information can be found in mongo quite easily:
mongo
use nmis; // or opFlow, check your config if you are not sure -- 'db_name' => 'opflow',
db.auth("opUserRW","op42flow42");
db.conversations.distinct("agent");
Using the tcpdump command from 8 can also be handy to see what is arriving, keep in mind that unwanted may be dropped/ignored by modifying flowd.conf.
opFlow 3
In opFlow 3 you find all agents supplying flows to your device in the GUI, in the "System" - "Agents" menu. A more precise status can be obtained from the opflow-cli command-line tool:
/usr/local/omk/bin/opflow-cli.pl act=list-agents
#...
Agent IP        In Intf Out Intf        Active  Last Seen
120.29.0.102    2       1       active  Thu Jun  9 11:49:56 2016
120.29.0.102    1       2       active  Thu Jun  9 11:49:56 2016
120.29.0.102    1       0       active  Thu Jun  9 11:49:56 2016
#...
In the example above you can see for what interfaces and when agents have supplied data. The cli tool also lets you disable agents or particular agent-input-output combinations.
10. Ignoring flow sources
When configurations are copied from one device to another flow configuration can come with them, this can lead to more flows being sent to opFlow than is expected. The best solution to this problem is to stop the device from sending flows, but this cannot always be done (or done in a timely manner).
(opFlow 2) Filtering sources in flowd
To solve this issue flowd.conf allows setting which devices to accept flows from, or which to ignore.
Editing /usr/local/etc/flowd.conf
# accept from a specific source
flow source 192.168.1.1
# or from a subnet
flow source 192.168.1.0/24

# more examples can be found in flowd.conf
(opFlow 3) Deactivating agents with opflow-cli.pl
opFlow 3 provides built-in filtering mechanisms (but you might also instruct nfcapd to ignore certain parties).
To ignore an agent, first retreve a list of known agents, with opflow-cli.pl act=list-agents; Identify the undesirable source(s), then run
/usr/local/omk/opflow-cli.pl act=update-agent agent=1.2.3.4 in_if=42 out_if=99 admin_status=inactive
with the desired agent ip address and in and out interface indices. If you omit the in_if and out_if arguments, all flow data from this agent is ignored; otherwise only flows that pass the specifed interfaces in the given direction are filtered out. Please note that deactivating an agent does not affect flows that have already been processed; only future inputs are filtered.
11. opFlow and opFlowSP are both set under opCommon.nmis 'omkd' => 'load_applications'
Either opFlow or opFlowSP should be set, not both.
Otherwise, for example, opFlow uses the incorrect database in mongodb, 'flowsp' rather than 'flows'.
When making a change to this setting from opFlow to opFlowSP, and vice versa, restart the opflowd and omkd services:
sudo service opflowd restart
sudo service omkd restart