Node Health Report
The Node Health report display health-related attributes for all selected nodes for a given period. Attributes displayed are: Status, Device, Availability, Interface Availability, %CPU, 95th% CPU, Max %CPU, CPU Exc., %Mem Free, 95th% Mem Used, Max %Mem Used, %Mem Util, %IO/VIR Mem Free, 95th% IO Mem Used, Max %IO Mem Used, %IO/VIR Mem Util. As of version 3.1.4 when this report is exported to XLSX and CSV formats the following columns of information are also displayed: Group, %IO Mem Free.
The report also includes two columns with the detected (abnormal) Conditions and the recommended Actions.
If you pass this report the option exceptions=true, then only nodes with exceptional conditions present are shown; the default is to show all nodes.
Below shows the outcome of a default Node Health Report or where exceptions=false. The full report can be viewed by downloading the ZIP file HERE

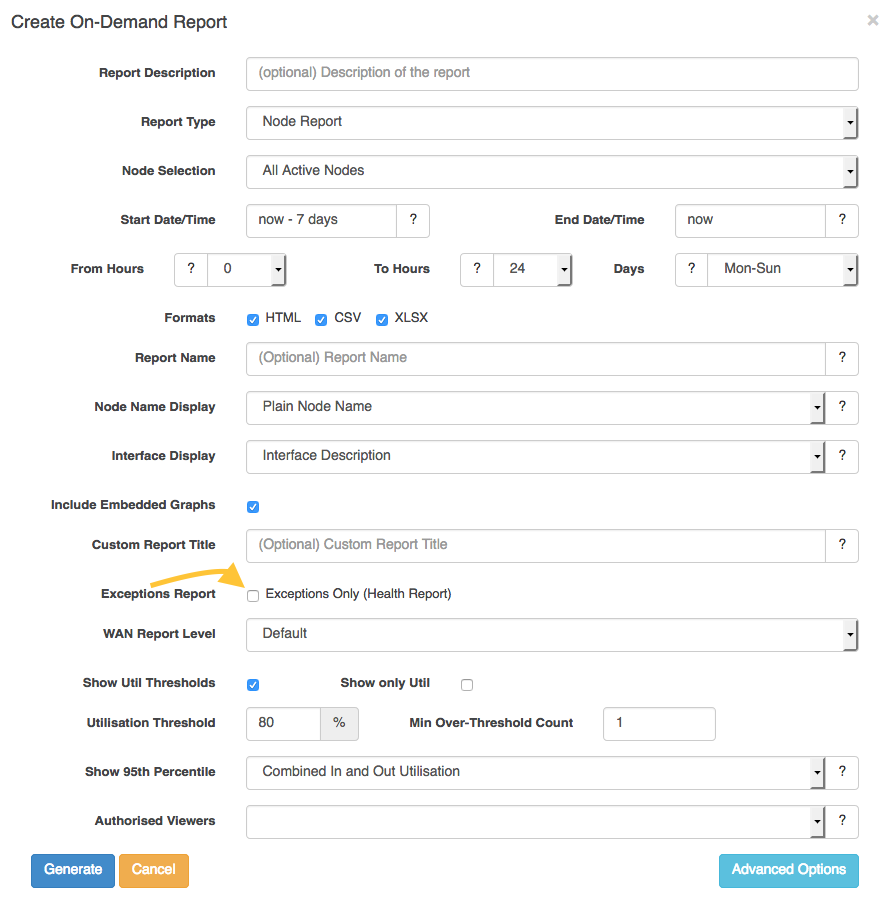
To create a Node Health Report showing exceptions only, click the box that the arrow points to in the image below.
A Node Health Report using the same devices where exceptions=true looks similar to the image below. The full report can be viewed by downloading the ZIP file HERE

The formulas used for calculation of the reporting conditions can be tuned and adjusted by the user:
The section opreports_rules (in conf/opCommon.nmis in opReports 3.x, or opReports.nmis in version 2.x) defines the threshold values for the following conditions:
Device Availability = Condition: "Device has LOW or VERY LOW availability"
Action: Investigate causes for low availability
Formula used for Calculation:
- Very Low device availability less than 99.9
- Low device availability less than 99.999
Interface Availability = Condition: "Device has LOW or VERY LOW interface availability"
Action: Investigate causes for low interface availability
Formula used for Calculation:
- Very Low interface availability less than 80
- Low interface availability less than 95
CPU Utilisation = Condition: "Device has VERY HIGH, HIGH or MODERATE CPU utilisation"
Action: Investigate causes for CPU utilisation
Formula used for Calculation:
- Very High CPU utilisation: greater than 30%
- High CPU utilisation: greater than 20%
- Moderate CPU utilisation: greater than 12%
If the node has multiple CPUs then the utilisation measure is averaged over all CPUs.
CPU Exceptions
The count of times the CPU utilisation exceeded the "CPU Exception Threshold" of 20%. If the node has multiple CPUs then this is the sum of the exception counts of all CPUs.
Memory Utilisation = Condition: "Device has VERY LOW or LOW main memory free"
Action: Investigate causes for free low main memory
Formula used for Calculation:
- Very Low free main memory less than 10
- Low free main memory less than 25
IO or Virtual Memory Utilisation = Condition: "Device has VERY LOW or LOW IO or Virtual memory free"
Action: Investigate causes for low free IO or Virtual memory
Formula used for Calculation:
- Very Low free main memory less than 10
- Low free main memory less than 25
opReports 3.5.1 and newer include improvements to memory related fields in the Node Health Report
/path/to/omk/conf/opCommon.json has a new setting with default being /opreports/on_invalid_hrcachemem_use_only_hrmem=0.
- With /path/to/omk/conf/opCommon.json set at opreports/opreports/on_invalid_hrcachemem_use_only_hrmem=1,
opReports attempts to detect situations where invalid hrCacheMemUsed and hrCacheMemSize
values are being reported that would cause the memory related fields in the Node Health Report to return as negative values.- In such a case (detect memory related fields in the Node Health Report would negative values),
hrCacheMemUsed and hrCacheMemSize will not be used in the calculation of memory related fields
and a suitable entry to this effect will be logged in opReports.log. - This issue has been detected in docker instances where hrCacheMemUsed and hrCacheMemSize values
were that of the docker host and not that of the docker instance itself.
- In such a case (detect memory related fields in the Node Health Report would negative values),
- With /path/to/omk/conf/opCommon.json set at opreports/opreports/on_invalid_hrcachemem_use_only_hrmem=0:
- In such a case (detect memory related fields in the Node Health Report would negative values),
affected memory related fields will return N/A and a suitable entry to this effect will be logged in opReports.log.
- In such a case (detect memory related fields in the Node Health Report would negative values),