7 answers
- 210
Deepak,
If you have upgraded from a previous version of NMIS, I think the most likely thing is that you are running two lots of cron jobs. During the NMIS 8.5.6G the installation would have asked you if you wanted to change your cron jobs over to using a new method, and to remove the old entries from the global crontab.
You can verify this by running as the root user the command "crontab -l", if you find lots of NMIS related things in there, and if you run "cat /etc/cron.d/nmis" and you get some very similar entries, you have double NMIS running.
The easiest thing to do is to move the cron.d file which will stop the double polling. So run the command "mv /etc/cron.d/nmis ~", which will move the file to the root user home directory.
OR the best option is to remove or comment the entries in the crontab, if you are comfortable editing files on Linux, run "crontab -e" and comment out, append a # in front of the line, or remove the NMIS related entries.
If you do not have duplicate cron issues, please let me know.
Regards
Keith
Add your comment... - 10-1
Hi Deepak,
We upgraded NMIS to Ver 8.5.6G and running a VM appliance on 4GB RAM too, we were also getting lots of NMIS Runtime exceeded warnings. No cpu or memory issues found. From last time we remember these messages started when we changed the poll time from default 300 sec to 60 sec. After some investigations we found that when nmis.pl process is running it's taking more than 60 sec to finish and after 60 sec another process started. We changed the poll time value back to its default which is 300 sec and we found no Runtime exceeded warning.
We need to fix that because NMIS on random time send us false alarm saying a lot of nodes down (physically they are not) hopefully this will fix the issue.
I have a question with Experts, if we need to change poll time to less than 5 min do we need to increase VM resources which we can see any issues with or this is a bug with NMIS?
Thanks
Add your comment... - 10-1
Deepak,
You have disabled both the cron systems, you should have disabled one or the other, can you can run this command to restore the best option.
mv ~/nmis /etc/cron.d/nmis
Keith
Add your comment... - 10-1
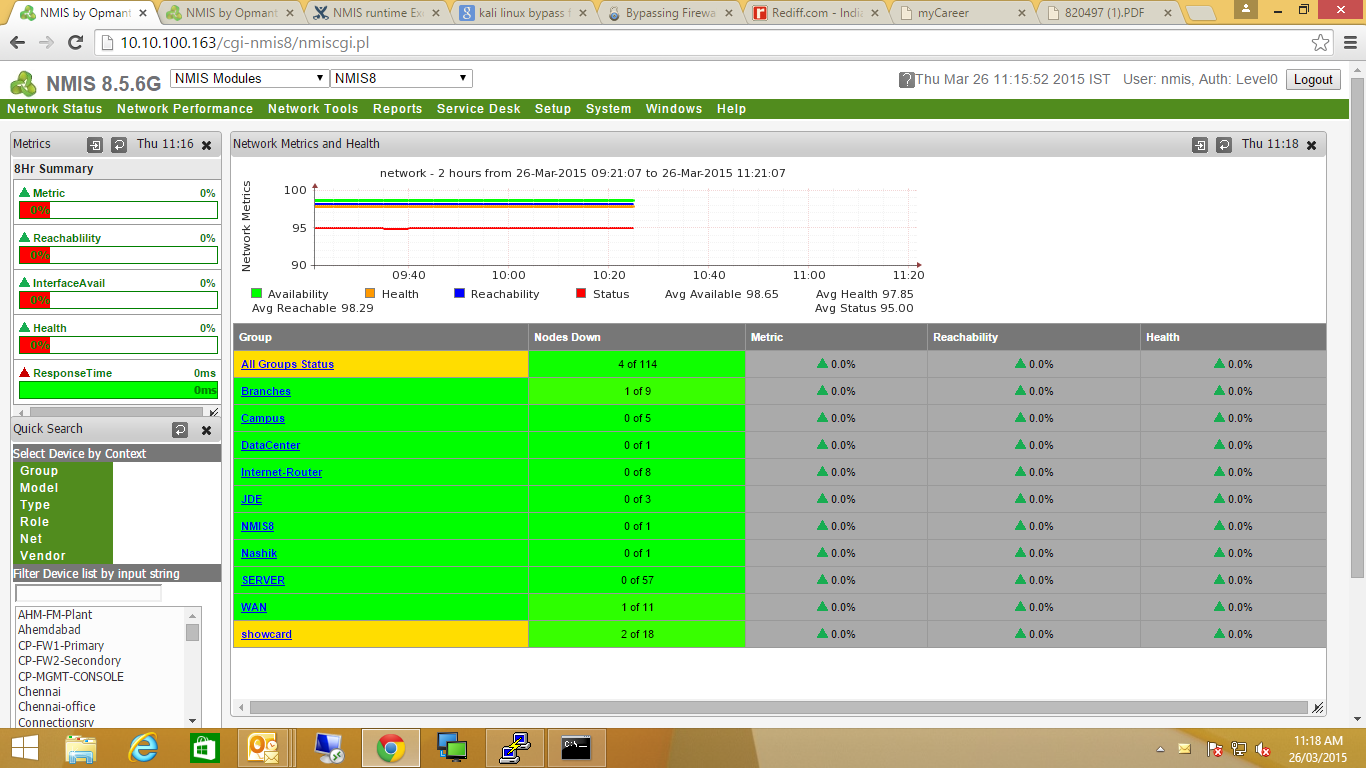
Hi
Below is the screenshot. No data collection since I did modifications.
Thanks
 Add your comment...
 - 10-1
All my data is gone all set to Zero and no collection of data is being done. I have rebooted the server
Add your comment... - 10-1
Deepak,
Did you have two lots of cron entries?
You can monitor the server very closely using the command "top" which will help you to see how the server is performing.
Keith
Add your comment... - 10-1
Hi
After updating to 8.5.6G I am getting continuous Warning of NMIS runtime exceeded for most of the nodes. After 2-3 days I get self test failed error as swap memory utilized to 99%. We are running it on VM with 4 GB RAM.
Below is output of top command This is after restarting the server yesterday
top - 09:18:00 up 23:40, 1 user, load average: 0.14, 0.27, 0.22
Tasks: 136 total, 1 running, 135 sleeping, 0 stopped, 0 zombie
Cpu(s): 0.2%us, 0.2%sy, 0.0%ni, 99.7%id, 0.0%wa, 0.0%hi, 0.0%si, 0.0%st
Mem: 3924684k total, 3400596k used, 524088k free, 123860k buffers
Swap: 4169720k total, 3048k used, 4166672k free, 2857420k cached
PID USER PR NI VIRT RES SHR S %CPU %MEM TIME+ COMMAND
1129 root 20 0 1030m 37m 6732 S 0.3 1.0 3:32.49 mongod
24451 root 20 0 15028 1324 1000 R 0.3 0.0 0:00.01 top
1 root 20 0 19232 1260 1112 S 0.0 0.0 0:00.79 init
Please help.
Thanks
Deepak Khemani