...
| Field Name | Function |
|---|---|
Name | This name is primarily administrative and will be used to identify the chart on the Views->Home->Charts page. |
| Desc. | A description field that will appear on the Views->Home->Charts page. |
| Title | This title will appear at the top of the chart. |
| Time Period | The default time period of the chart when it is initially displayed. Once you start typing the format and options will display. A user may change this once the chart is selected in order to access the time period they are interested in. |
| Left Y-Axis Title | This description will appear on the left side of the chart representing the scale of 'axis 0'. When selecting the data set we well be presented with the axis option. |
| Right Y-Axis Title | This description will appear on the right side of the chart represting the scale of 'axis 1' . When selecting the data set we well be presented with the axis option. |
| Only Stacks in Legend | Need to define! |
| Save | Select this to save the chart. |
| Add Dataset | Select this to add data sets to the chart. |
Adding Datasets
Click 'Add Dataset' in order to add data sets to the chart. A window such as the following will be presented.
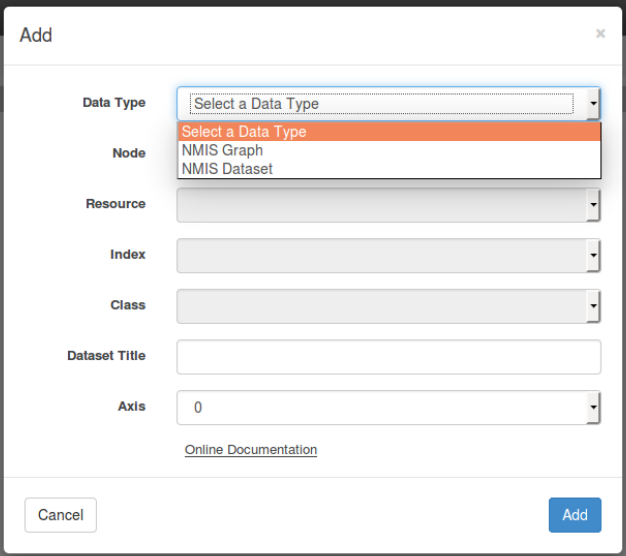
The first option is 'Data Type'. Clicking on this field the user will be presented with two choices; 'NMIS Graph' or 'NMIS Dataset'. For this example choose 'NMIS Dataset'.