...
In addition to building charts from NMIS' device data, opCharts includes a series of predefined charts specifically focused on providing detailed insight into system performance and metrics. Six of these charts are included on the TopN View (Select Views -> TopN from the opCharts menu bar) page. The NMIS Event log is also included on each device's detail screen.
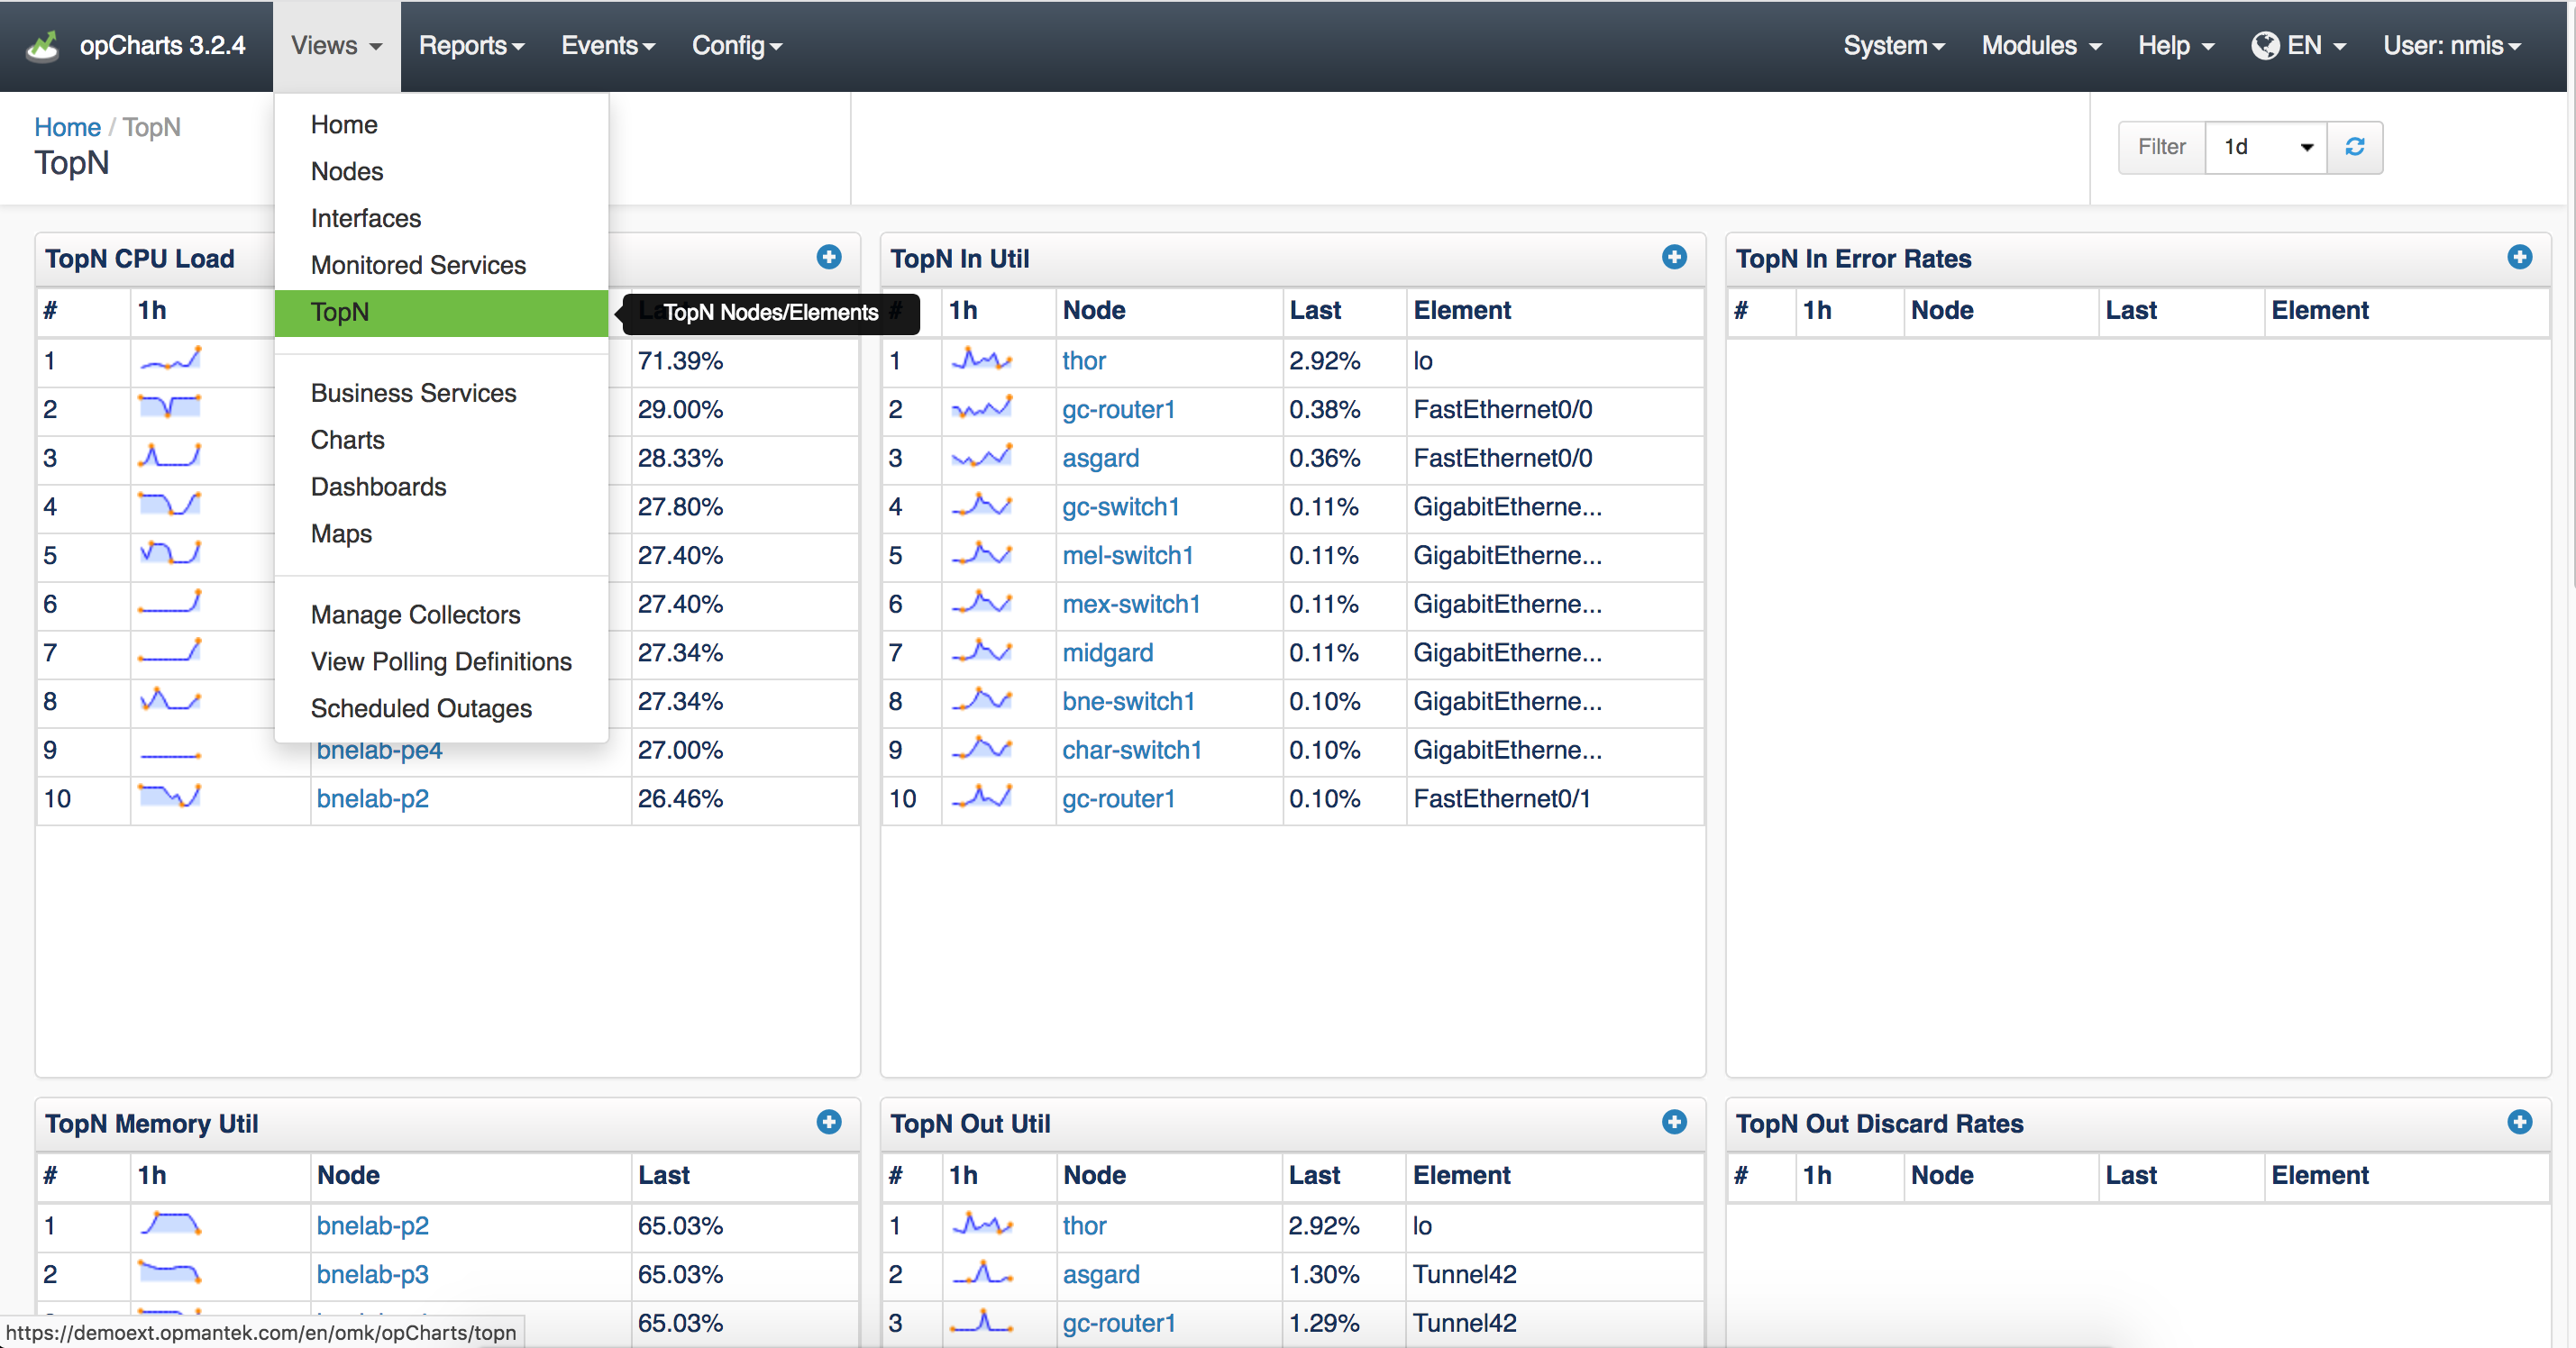
Available Charts
- TopN CPU Load
- TopN Memory Used
- TopN in Util
- TopN Out Util
- TopN Error Rates
- TopN Out Discard Rates
- NMIS Event Log
...