...
| View | Description |
|---|---|
| (1) Node Filter | List of filters to be applied to the nodes table. |
| (2) Current Filters | Current filters applied to the nodes table. |
| (3) Nodes Table | Nodes table displaying filtered nodes. |
| (4) View in Network Map | Takes selected nodes to generate a Network Map. (See Topological Map below) |
| (5) View in Geographical Map | Takes selected nodes to generate a Geographical Map. (See Geographical Map below) |
| (6) Search Filter | Search for specific Node Names, Hosts, Groups, or Locations. |
...
Creating a dynamic map saves the ‘dynamic’ flag into the map as well as the filter used to create the map. When the map is saved the list of nodes is thrown away, their locations are thrown away, any changes made to the map view are basically thrown away. This is because everything in the map is dynamic, it’s generated from the filter. The user can only change the name, description, and title. In the map creator you’ll notice that all the “Component” buttons are grayed out and some text above them has been added "Components cannot be added to dynamic maps.” as shown in the image below. Things like positioning and zooming are not saved, when the map is loaded all matching nodes are added and then the map is told to make all nodes fit into the view. Both types of Geographical maps can be added to the Dashboard.

Viewing multiple devices stacked at one location made easier
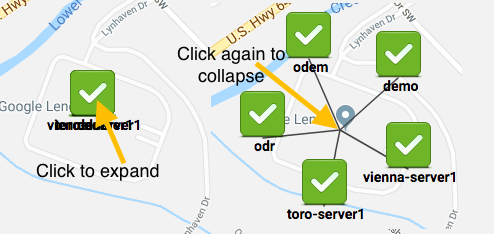
Another feature added in opCharts 3.2.7 is Geographic maps that have many nodes in the exact same spot will now fan out when clicked so all nodes from that spot can be easily seen. Notice the image below has groups of clustered devices at or near the same location displaying the devices at each geographical location. Clicking these clusters will drill into this location displaying each device at this location.

When clicking the cluster you are brought to a screen similar to the one shown below in the image to the left. Clicking this group of devices will fan or expand these devices out organizing them making it easier to view specific device information. When the devices are expanded you can click on each one quickly granting you information on that device as well as allowing you to view the device details page by clicking the node name in the popup window.
...
Topological Map
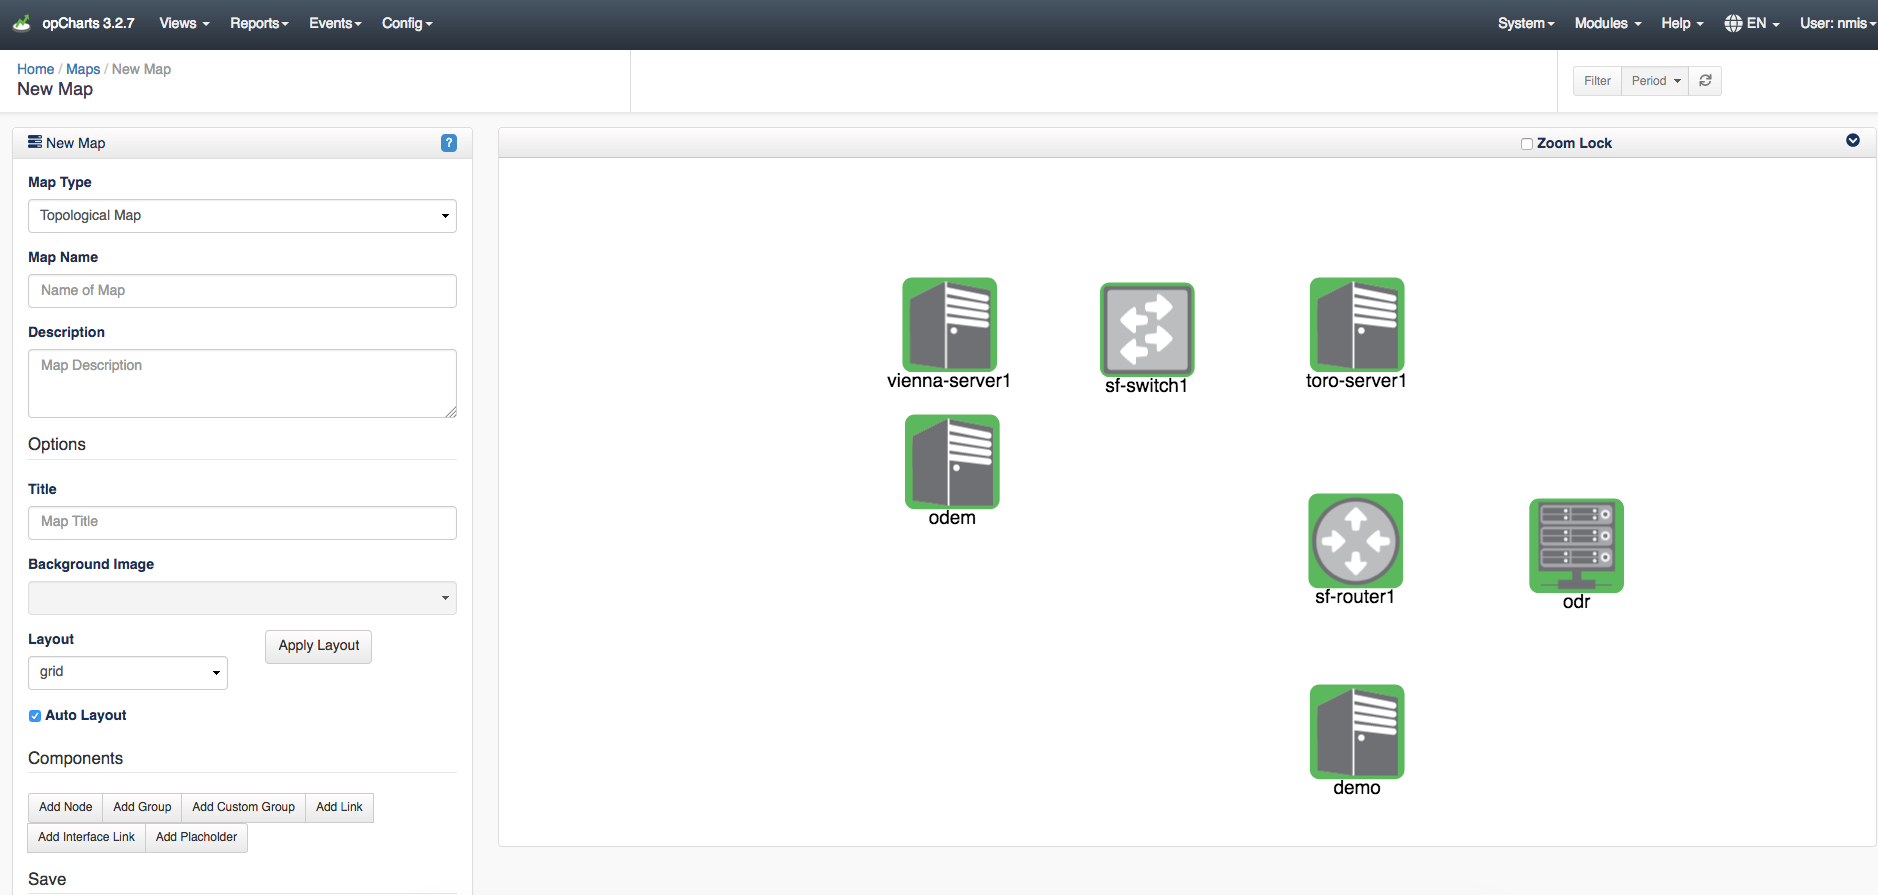
When creating a Topological Map the user is put into the map 'creator' because topological maps aren't as useful if the user cannot right click and choose to add subnets or neighbors etc. and those functions are not available when just viewing the map. When the topological map is saved the dynamic flags are thrown away and the list of nodes that are on the map are saved into the map definition making it 'static'. At the moment there is no way to save a dynamic topological or network map. After saving the map, it can be added to the dashboard.
Viewing multiple devices stacked at one location easier
Another feature added in opCharts 3.2.7 is Geographic maps that have many nodes in the exact same spot will now fan them out when clicked so all nodes form that spot can be seen as shown by the image below:
...
...