...
A new dashboard can be created from the Dashboards view, ; select Views -> Dashboards from the opCharts menu bar, then click the New Menu Dashboard button located in the top-right corner.
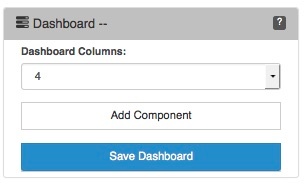
Dashboard Columns
Think of the dashboard's layout as a 2-dimensional grid. The Dashboard Columns field allow you to subdivide the usable horizontal space into equally spaced units. The horizontal width is defined by the browser window's width, but the vertical height is defined by the number and layout of the Components you add to the dashboard.
Adding a Component to a Dashboard
A component Component can be added to a dashboard Dashboard either by selecting the Add to Dashboard button (The ![]() button located in the top-right corner of every Component window) or by clicking the Add Component button from within the Edit Dashboard view.
button located in the top-right corner of every Component window) or by clicking the Add Component button from within the Edit Dashboard view.
Note: A component must exist before you can add it to a Dashboard
...
(see: Introduction to Components for more information).
Component Info
The Component info panel allows you to define the width and height of the Component's window, and the location of the Component's window within the Dashboard grid. The width and height field values are all relative to the number of columns set in Dashboard Column's field.

Next, select your Data Source Type, additional fields may appear based on the type of source you select.
Component Layout
Continue to add additional Components and arrange them in an order that presents the data clearly and with purpose


Saving the Dashboard
...