| Table of Contents |
|---|
Overview
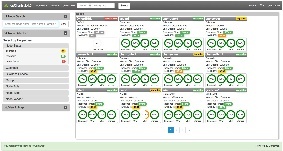
The Nodes view is the standard opCharts Homepage view, unless the user account has been assigned a default Dashboard. The Nodes view may also be accessed by selecting Views -> Nodes from the opCharts menu bar.
Standard View
The Nodes view presents each Node in an individual , customizable, panel. These panels are organized 12 panels to a page, and paginated.
...
Node Menu
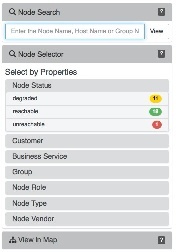
The Node Menu panel is located along the left-hand edge of the screen. It includes the ability to search for a specific Node, filter the list of Nodes displayed by any available metadata tag, and to view the current list of nodes in a topological view.
The Node Panel
The Node panels in opChart's Node view includes multiple status metrics, including:
- The node or device name (interactive - will bring you to the Device Details screen)
- Its current status (reachable, degraded, unreachable)
- Vendor
- Date & Time of last update
- Response Time (ping)
- Health Key Performance Indicator (KPI)
- Key Statistics, comprised of
- Reachability
- CPU Availability (how much CPU is available)
- Memory Availability (how much memory is available)
- Interface Availability (how much total Interface bandwidth is available)


