...
opCharts automatically creates a chart for each and every metric being reported back to NMIS. These charts can be accessed from within the Node Details screen. Select Views -> Nodes from the opCharts menubar, then select a node from the list to open the Nodes Detail screen.

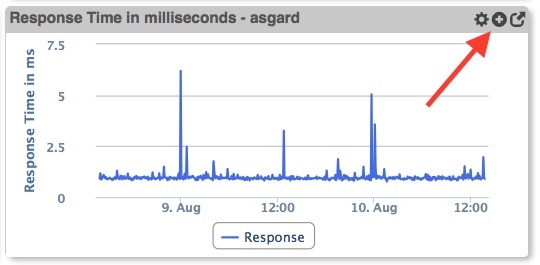
Any displayed chart can be added to a dashboard (existing or new) by clicking the Add to Dashboard button in the chart's titlebartitle bar.
Building a Simple Custom Chart
...
For charts that include non-normalized data (ie i.e data with base values which are either very dynamic or are widely separated) you can use both the left AND right-hand vertical axis to define separate ranges. PLease Please keep in mind that depending on the range(s) being display this can become visually deceiving.
Chart Considerations
Creating or Editing a Chart
1. A Chart must exist before it can be used or added to a Dashboard. To create a new Chart from scratch, Click the New Chart blue "+" icon from the Charts screen (Views -> Chart).

...
2. Assign your Chart a Name - This must be unique; no 2 two Charts can have the same Chart Name. Chart names should also not include spaces or special characters.
43. You can also provide a Description of your Chart. This will be displayed on the Charts View page, and also when adding a Chart to a Dashboard.
...