...
For each selected interface, it shows the configured input and output speeds, the observed maxima of input and output bandwidth for the report period, and the 95th percentile of the interface utilisation.
Before version 3.0.14, the 95th percentile for combined interface utilisation was shown (Combined utilisation in this report means the set of averages of each input and output utilisation reading). From 3.0.14 onwardsonward, you can select from three options: the 95th of combined utilisation, two separate columns for 95th of inpunt input and output utilisation, or three separate columns for 95th of input, output and combined utilisation.
...
The default choice is to include graphs but you can change that using the report option embedgraphs. In the GUI this option is named "Include Embedded Graphs". The graph contents are not configurable, but the graph size can be adjusted using the configuration option opreports_embedded_graph_size (default: 600 x 150 pixels).
To view the full version of this report you can download an example ZIP file HERE
An example report screen shot is below.

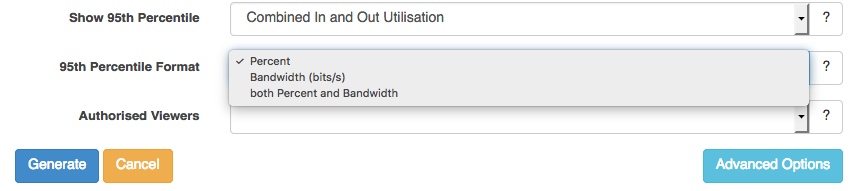
As of opReports version 3.1.4 the Interface Capacity Report now has the 95th display format option. This option is set under advanced features when generating the report and can display as Percent, Bandwidth (bit/s), or both Percent and Bandwidth.
Example report displaying both Percent and Bandwidth:
