| Table of Contents |
|---|
Introduction
opCharts power is found in the ability to create, assign, and save custom dashboards designed to address specific user or functional needs. For example, you might create a series of executive-level dashboards that only reflect very abstracted data based on the status of groups of nodes and display these on both geographic and topological maps. Other dashboards , however, meant for use by Tier-I technicians , might show node or device-level details , as well as interface information overlaid on a graphical network diagram. Each of these options can be quickly , and easily built using opCharts , then assigned for access by users with specific rights, and even made the default dashboards for certain users based on their role or responsibility.
The following section will describe what components can be added to a dashboard, the various methods for adding these components to a new or existing dashboard, how to organize the vial layout of the components, and how to control user access and assignment of the default dashboard.
Join Paul McClendon, an Opmantek Support Engineer, as he gives a. quick overview of creating a dashboard in opCharts.
| Widget Connector | ||||||
|---|---|---|---|---|---|---|
|
Dashboard Components
Every dashboard is constructed from individual Components organized within a 2-dimensional grid in a logical or visually appealing way. There are four basic components available for use in opCharts. These are:
...
A new dashboard can be created from the Dashboards view; select Views -> Dashboards from the opCharts menu bar, then click the New Dashboard button blue button with a "+" located in the top-right cornerleft corner to open the new dashboard screen.
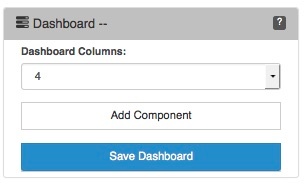

Dashboard Columns
...
- Name: The common name to be used when referring to this dashboard, used in all menus
- Description: Shown in the Dashboard View (Views->Dashboard)
- Dashboard Group: Assigns the Dashboard to a group, allows for fast indexing and selection when viewing dashboards in the same group .
- (so you don't have to go hunting to find related dashboards). The name given to the group will appear in a new section on the left side panel and each dashboard assigned to the group will be available in a select box.
Setting the Default Dashboard
The default dashboard is what you see when your first sign in to opCharts or when you click the opCharts icon in the top left corner of the screen. Any custom dashboard can be viewed in this spot, if no default dashboard is set opCharts automatically forwards you to the nodes view. This setting is stored per-user so each user can choose which dashboard they would like to see when they sign in.
To set your default dashboard view the dashboard you would like to be your default, on the left side menu click the button labeled "Make Default Dashboard." Clicking the opCharts logo should now display this dashboard on the opCharts home screen. If you click the "Make Default Dashboard" button on another dashboard it will replace your current selection.
To unset your default dashboard view the dashboard that is currently the default (Views→Dashboards, then click the dashboard name) and click the button labeled "Remove Default Dashboard." Clicking the opCharts logo should now redirect you to the nodes view.