| Table of Contents |
|---|
Overview
The Nodes view is the standard opCharts Homepage view, unless the user account has been assigned a default Dashboard. The Nodes view may also be accessed by selecting Views -> Nodes from the opCharts menu bar.
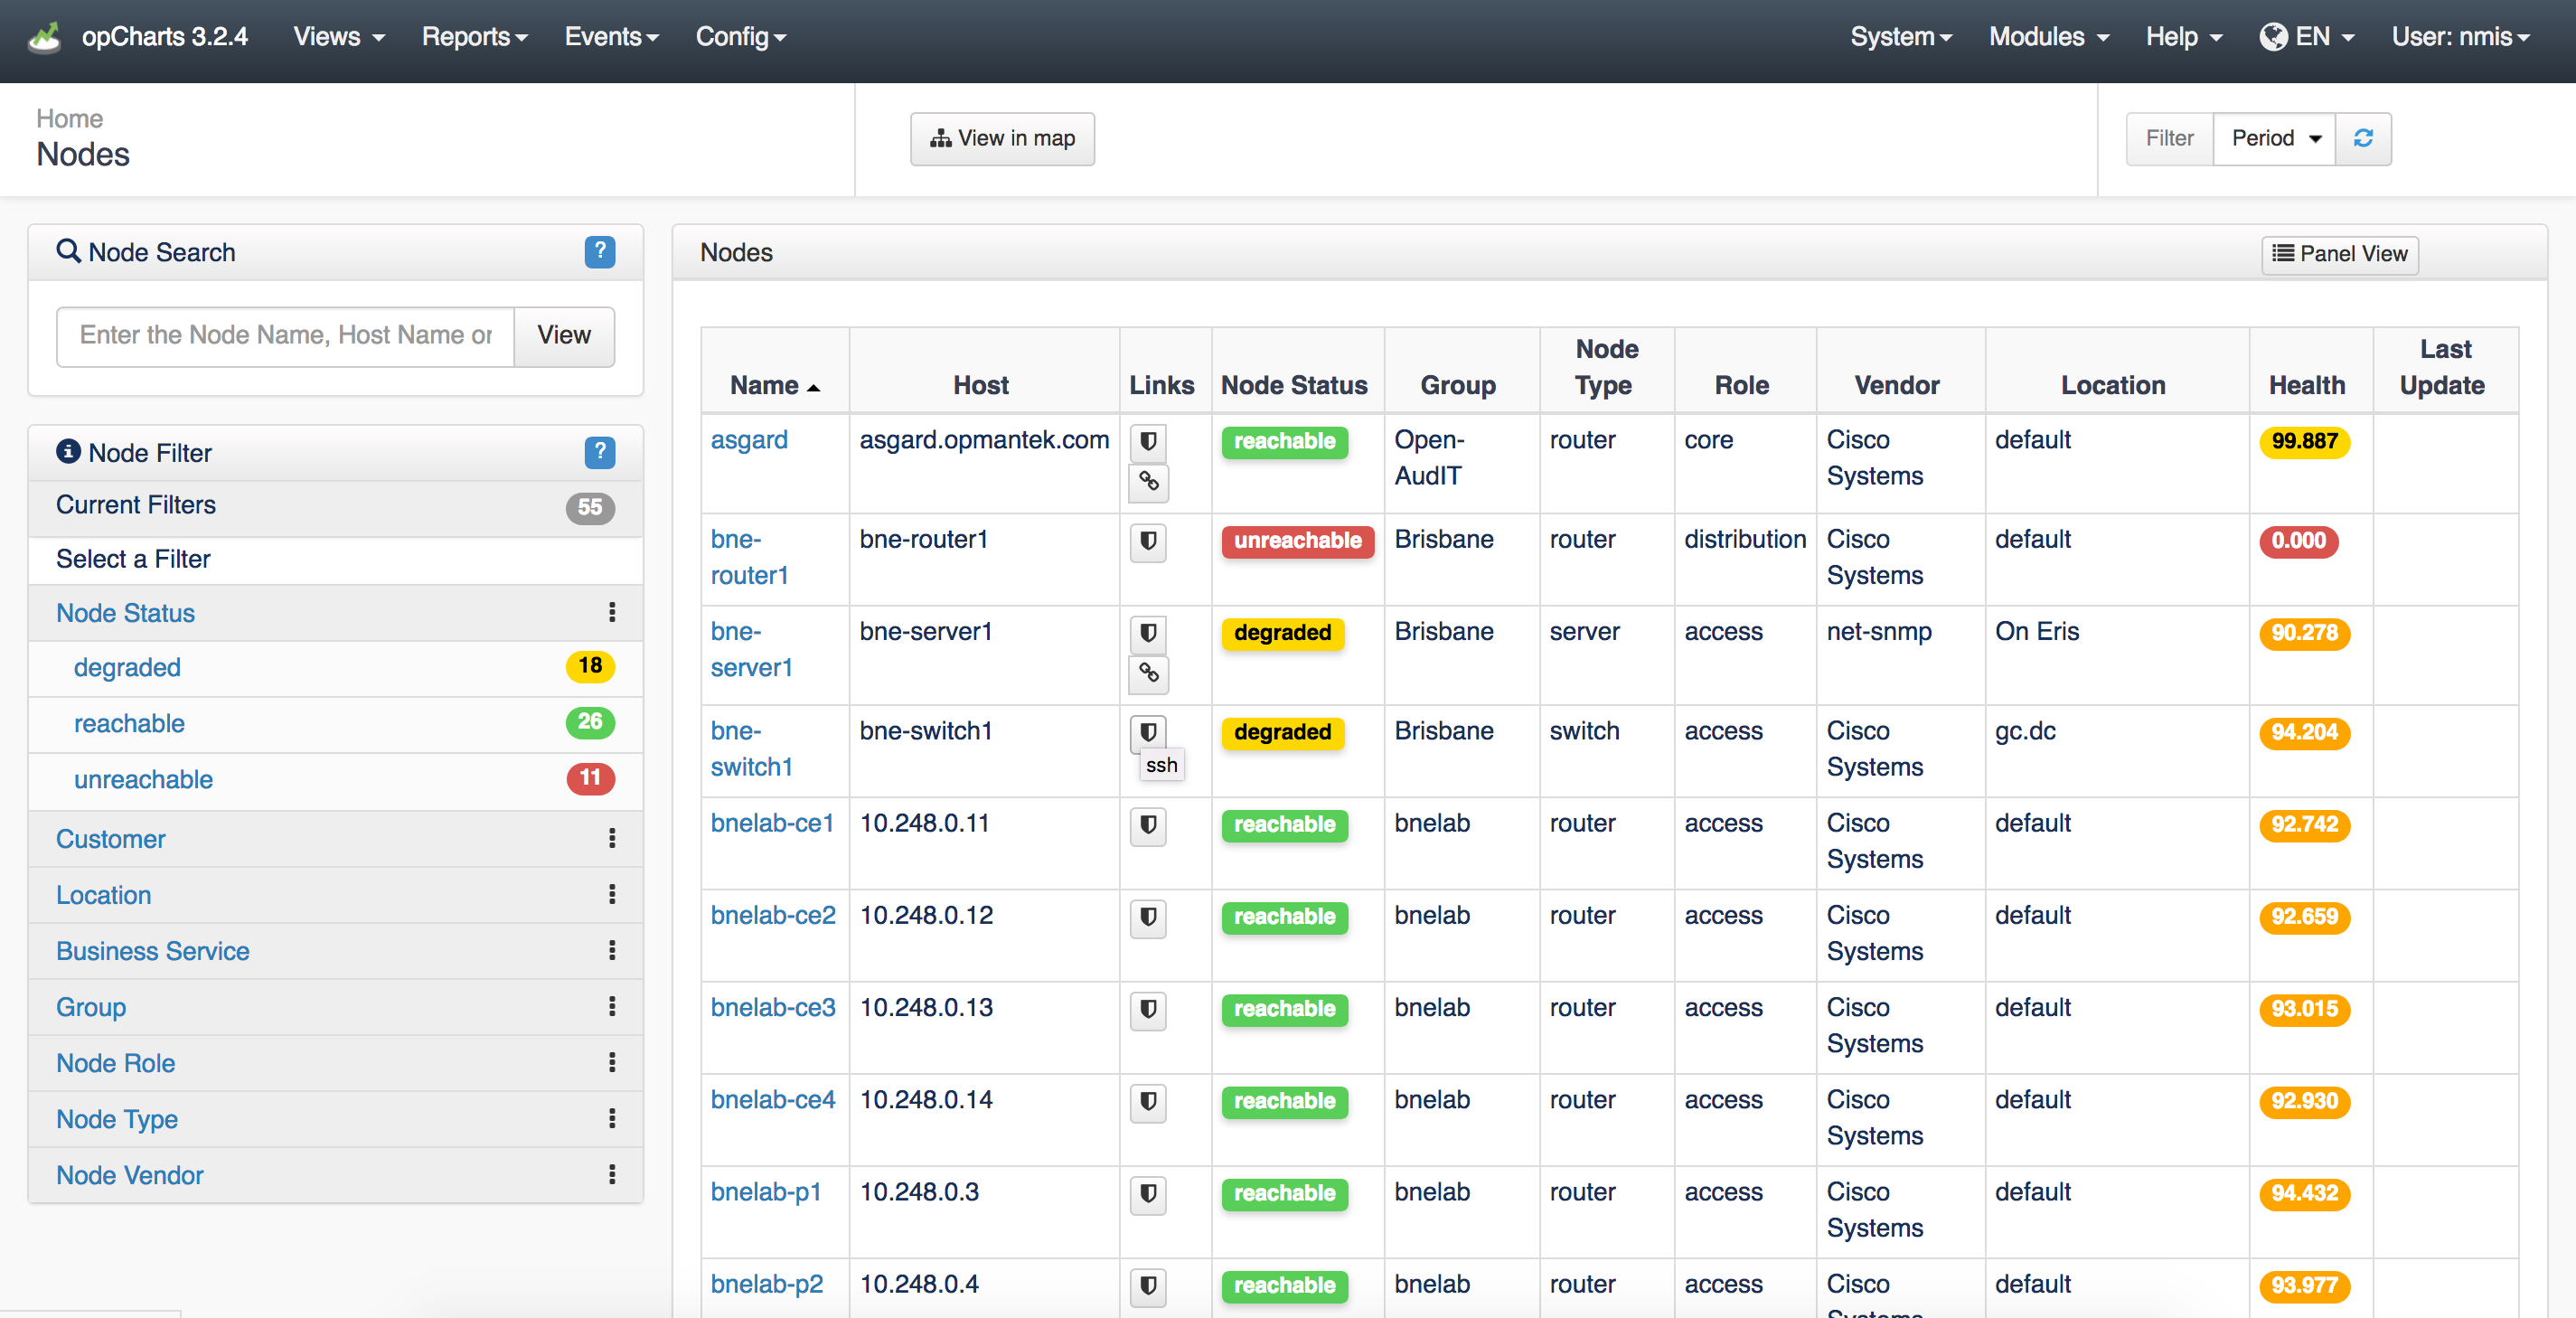
Table View
The Table view presents each Node in a structured table format.
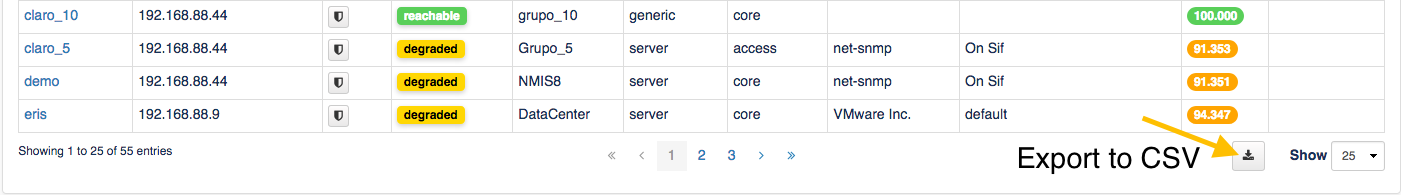
You can export this tables information to a CSV format. To do this, scroll to the bottom of the screen and click the icon displayed in the screen shot below:
It is possible to modify the fields to be exported by changing the configuration option (conf/opCommon.nmis):
opcharts_node_list_exporttocsv: This option accepts different values for opCharts 3 and opCharts 4.
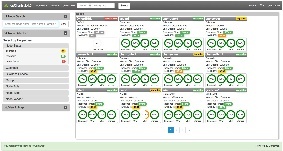
Panel View
The Nodes Panel view presents each Node in an individual , customizable, panel. These panels are organized 12 panels to a page.
Standard View
, and paginated. Click the Panel View at the top right of the screen as shown in the screenshot below to switch to Panel View.


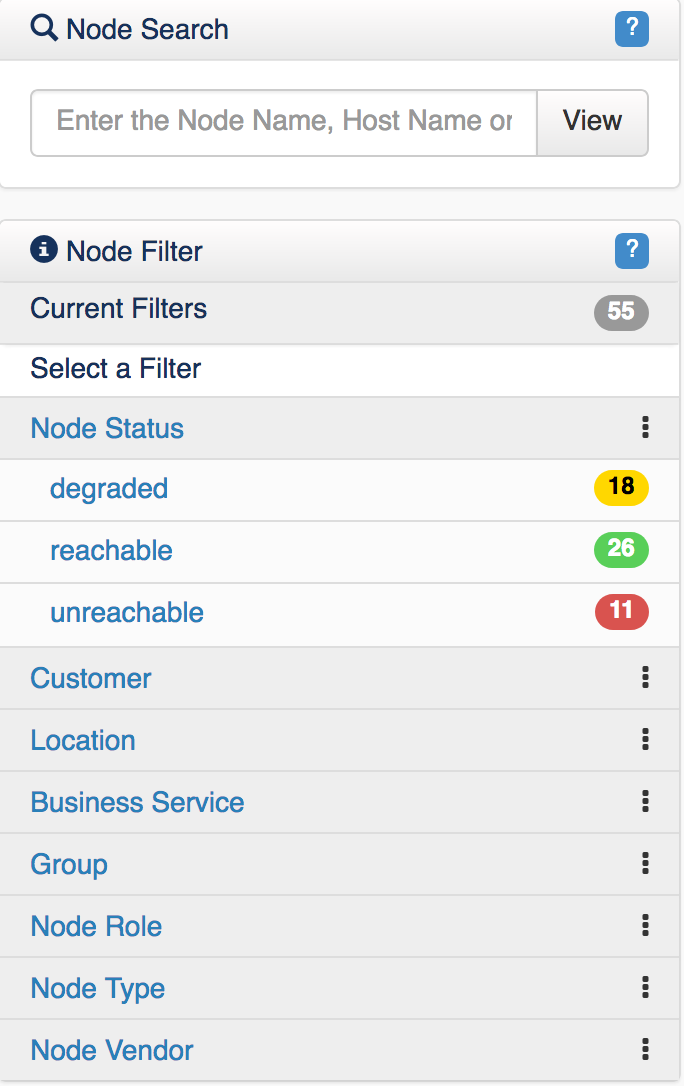
Node Menu
The Node Menu panel is located along the left-hand edge of the screen. It includes the ability to search for a specific Node, filter the list of Nodes displayed by any available metadata tag, and to view the current list of nodes in a topological view.

The Node Panel
The Node panels in opChart's Node view includes multiple status metrics, including:
- The node or device name (interactive - will bring you to the Device Details screen)
- Its current status (reachable, degraded, unreachable)
- Vendor
- Date & Time of last update
- Response Time (ping)
- Health Key Performance Indicator (KPI)
- Key Statistics, comprised of
- Reachability
- CPU Availability (how much CPU is available)
- Memory Availability (how much memory is available)
- Interface Availability (how much total Interface bandwidth is available)
