Table of Contents
Table of Contents
Overview
opCharts enables you to build dynamic interactive charts and targeted custom dashboards for single-pane-of-glass views into your NMIS data. It increases your network visibility and accelerates root cause discovery by combining multiple data sets on its adaptable graphical interface.
...
Enterprise Service rules calculate how each group of entities control the status of the Enterprise Service. The Enterprise Service rules are defined in /usr/local/omk/conf/ES_Rules.json
The rules set out levels on how each component should be degraded, based on the status level. It is set as an array of Level Type and Level.
...
Click the '+' icon to add a Node

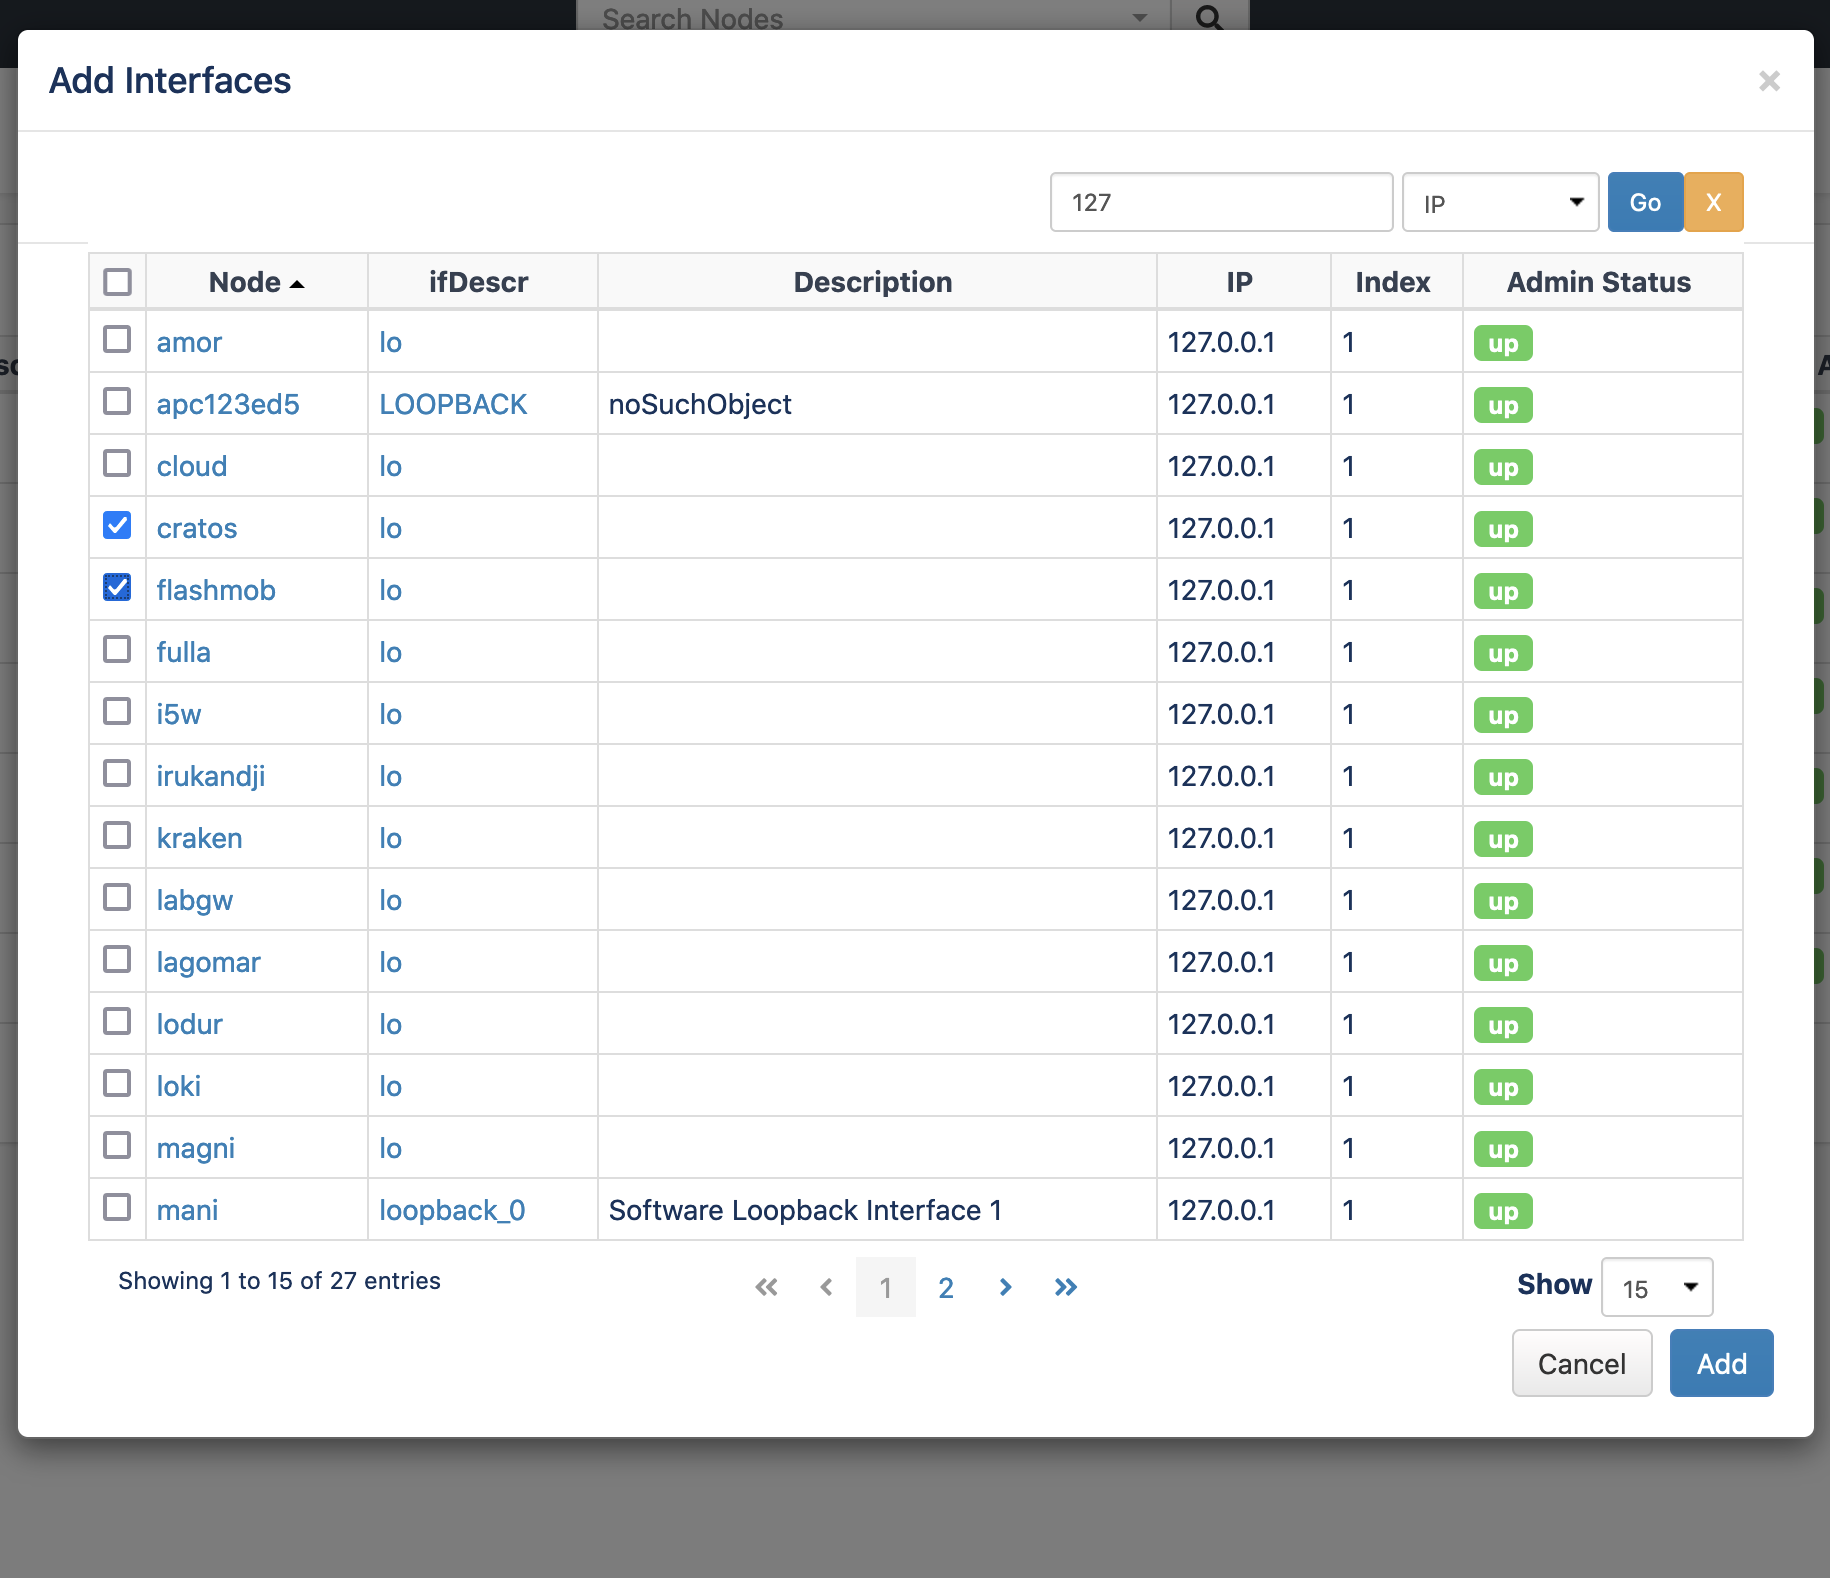
Add an Interface
To add a new interface, press the "+" icon in the Interfaces section as shown in the screen shot above. Enter or select the node name, select the interface index/name and press "Add".
Add a Node
Adding a Node is similar, press the "+" icon in the Nodes section. Enter the node name and press the "Add" button, a node panel for the selected node should now be displayed.

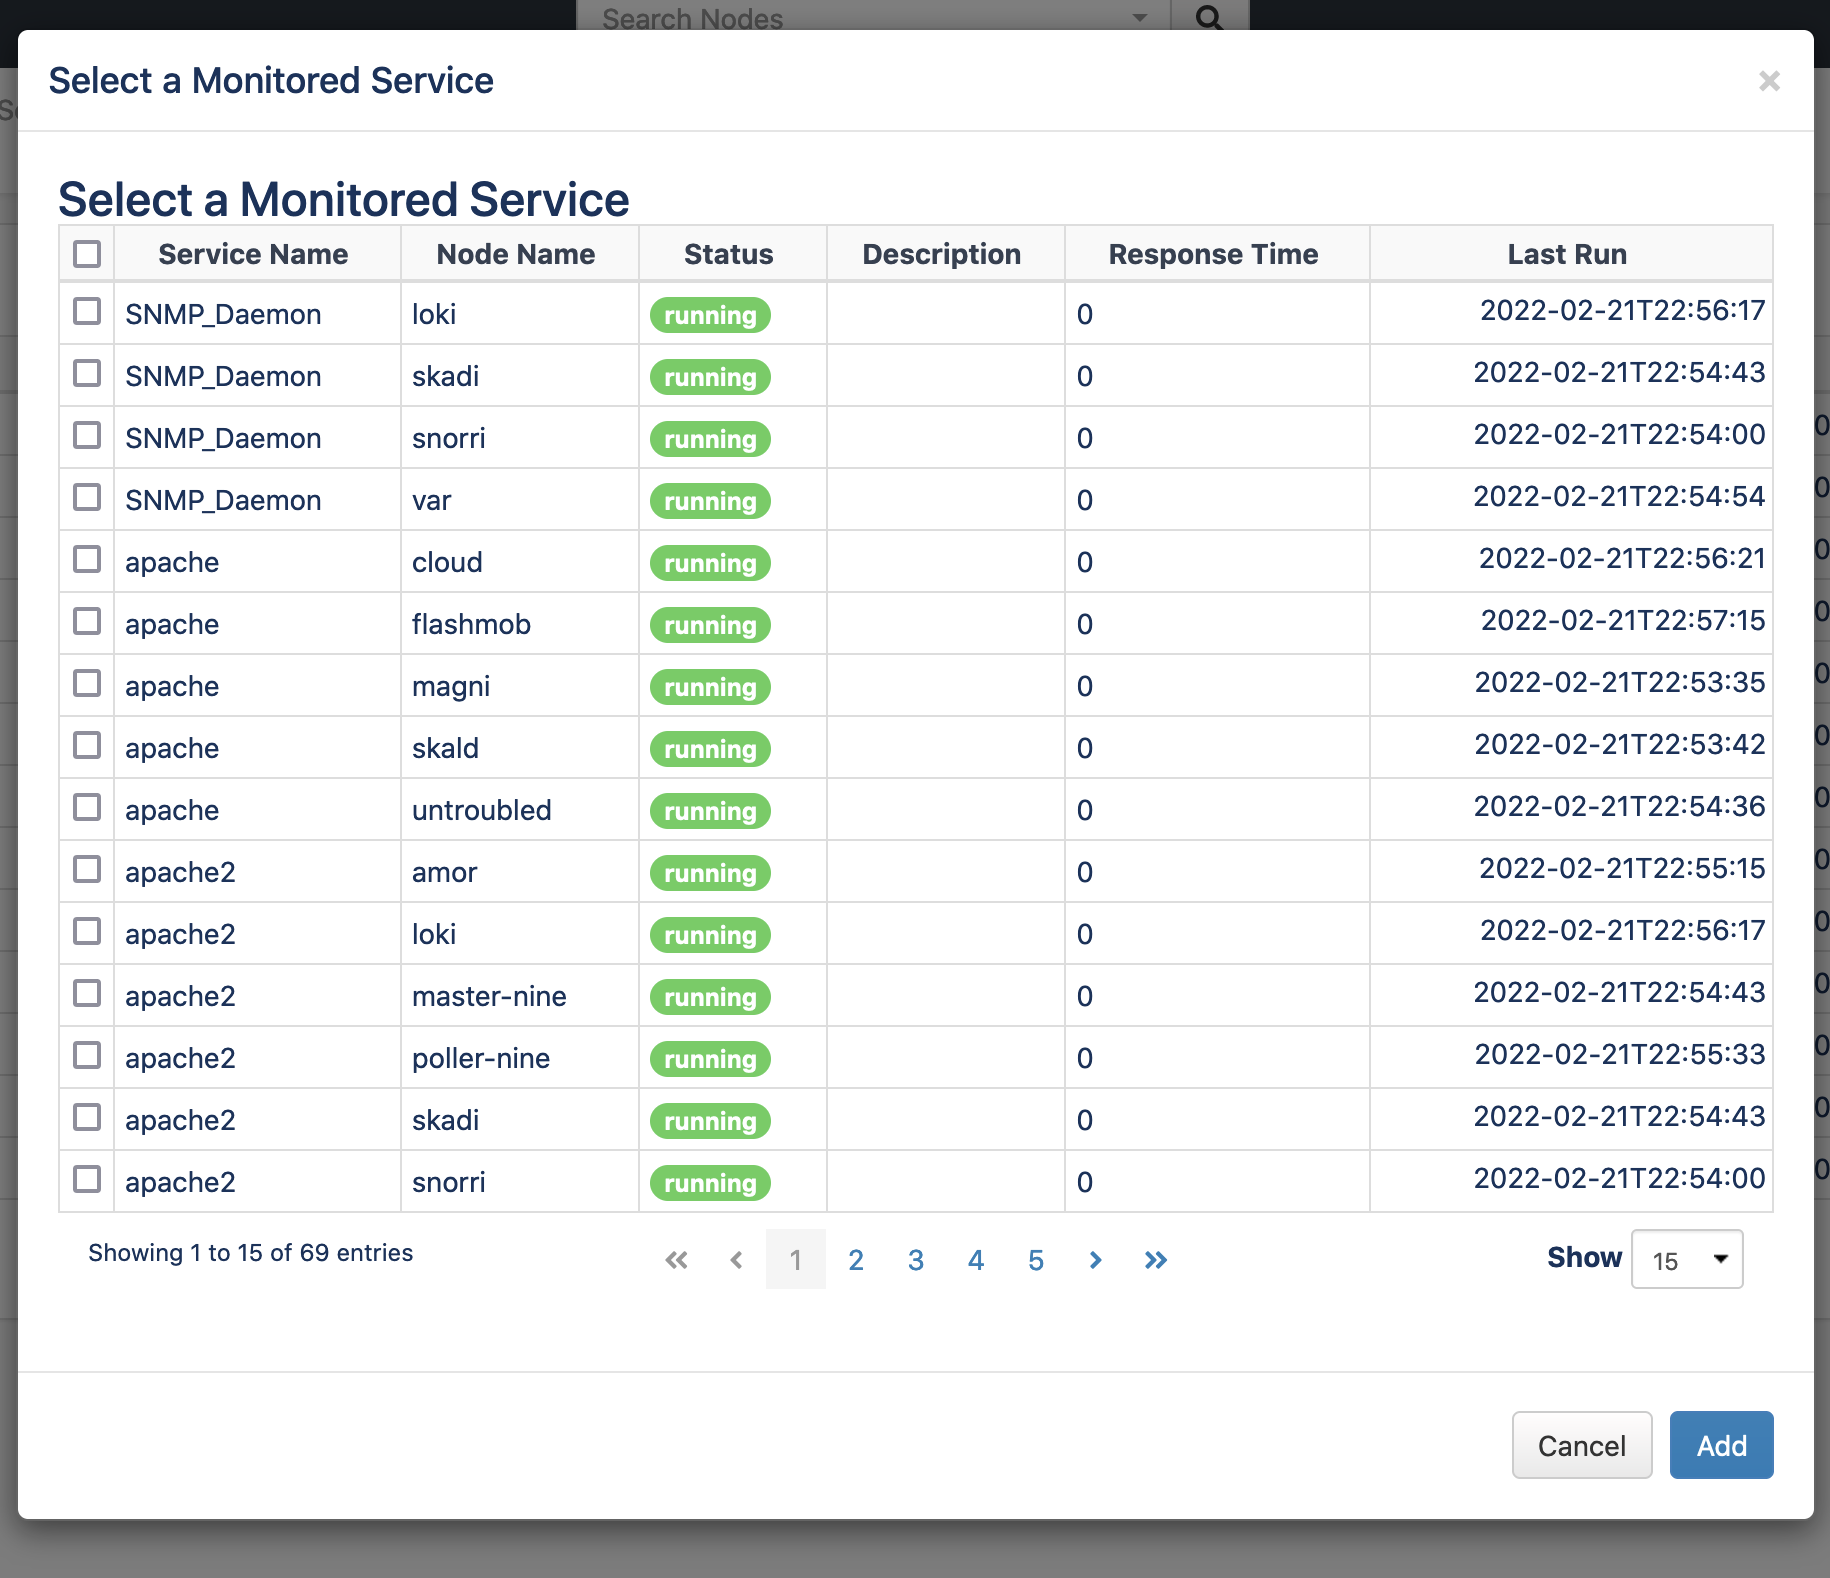
Add a Monitored Service
Remove an Interface, Node or Service
To remove either, press the "x" icon near the top right of the panel and it will be removed from the document. Save the document to accept your changes.
Repair RBAC for an Enterprise Service
We changed how an Enterprise Service is referenced in the database with opCharts-4.5.0 and this causes issues with RBAC (portal users) for Enterprise Services created before 4.5.0.
...