...
By abstracting data into Key Performance Metrics, and combining and sorting devices into dynamic groups through user-defined metadata, opCharts can easily support high-level abstracted user views at the 50,000 ft level while still allowing quick drill-down into detailed performance metrics for fast problem resolution.
...
opCharts supports three primary views - Nodes, Dashboards, and TopN.
Nodes View
The To open the Nodes View can be opened by selecting View , select Views -> Nodes from the opCharts menu bar. The Nodes View abstracts each nodes performance information into easy-to-understand panels. These panels include such information as the node name, node status, vendor, and key performance information regarding each node.
...
The Nodes view is the default view for opCharts unless a default Dashboard has been assigned to the user account.
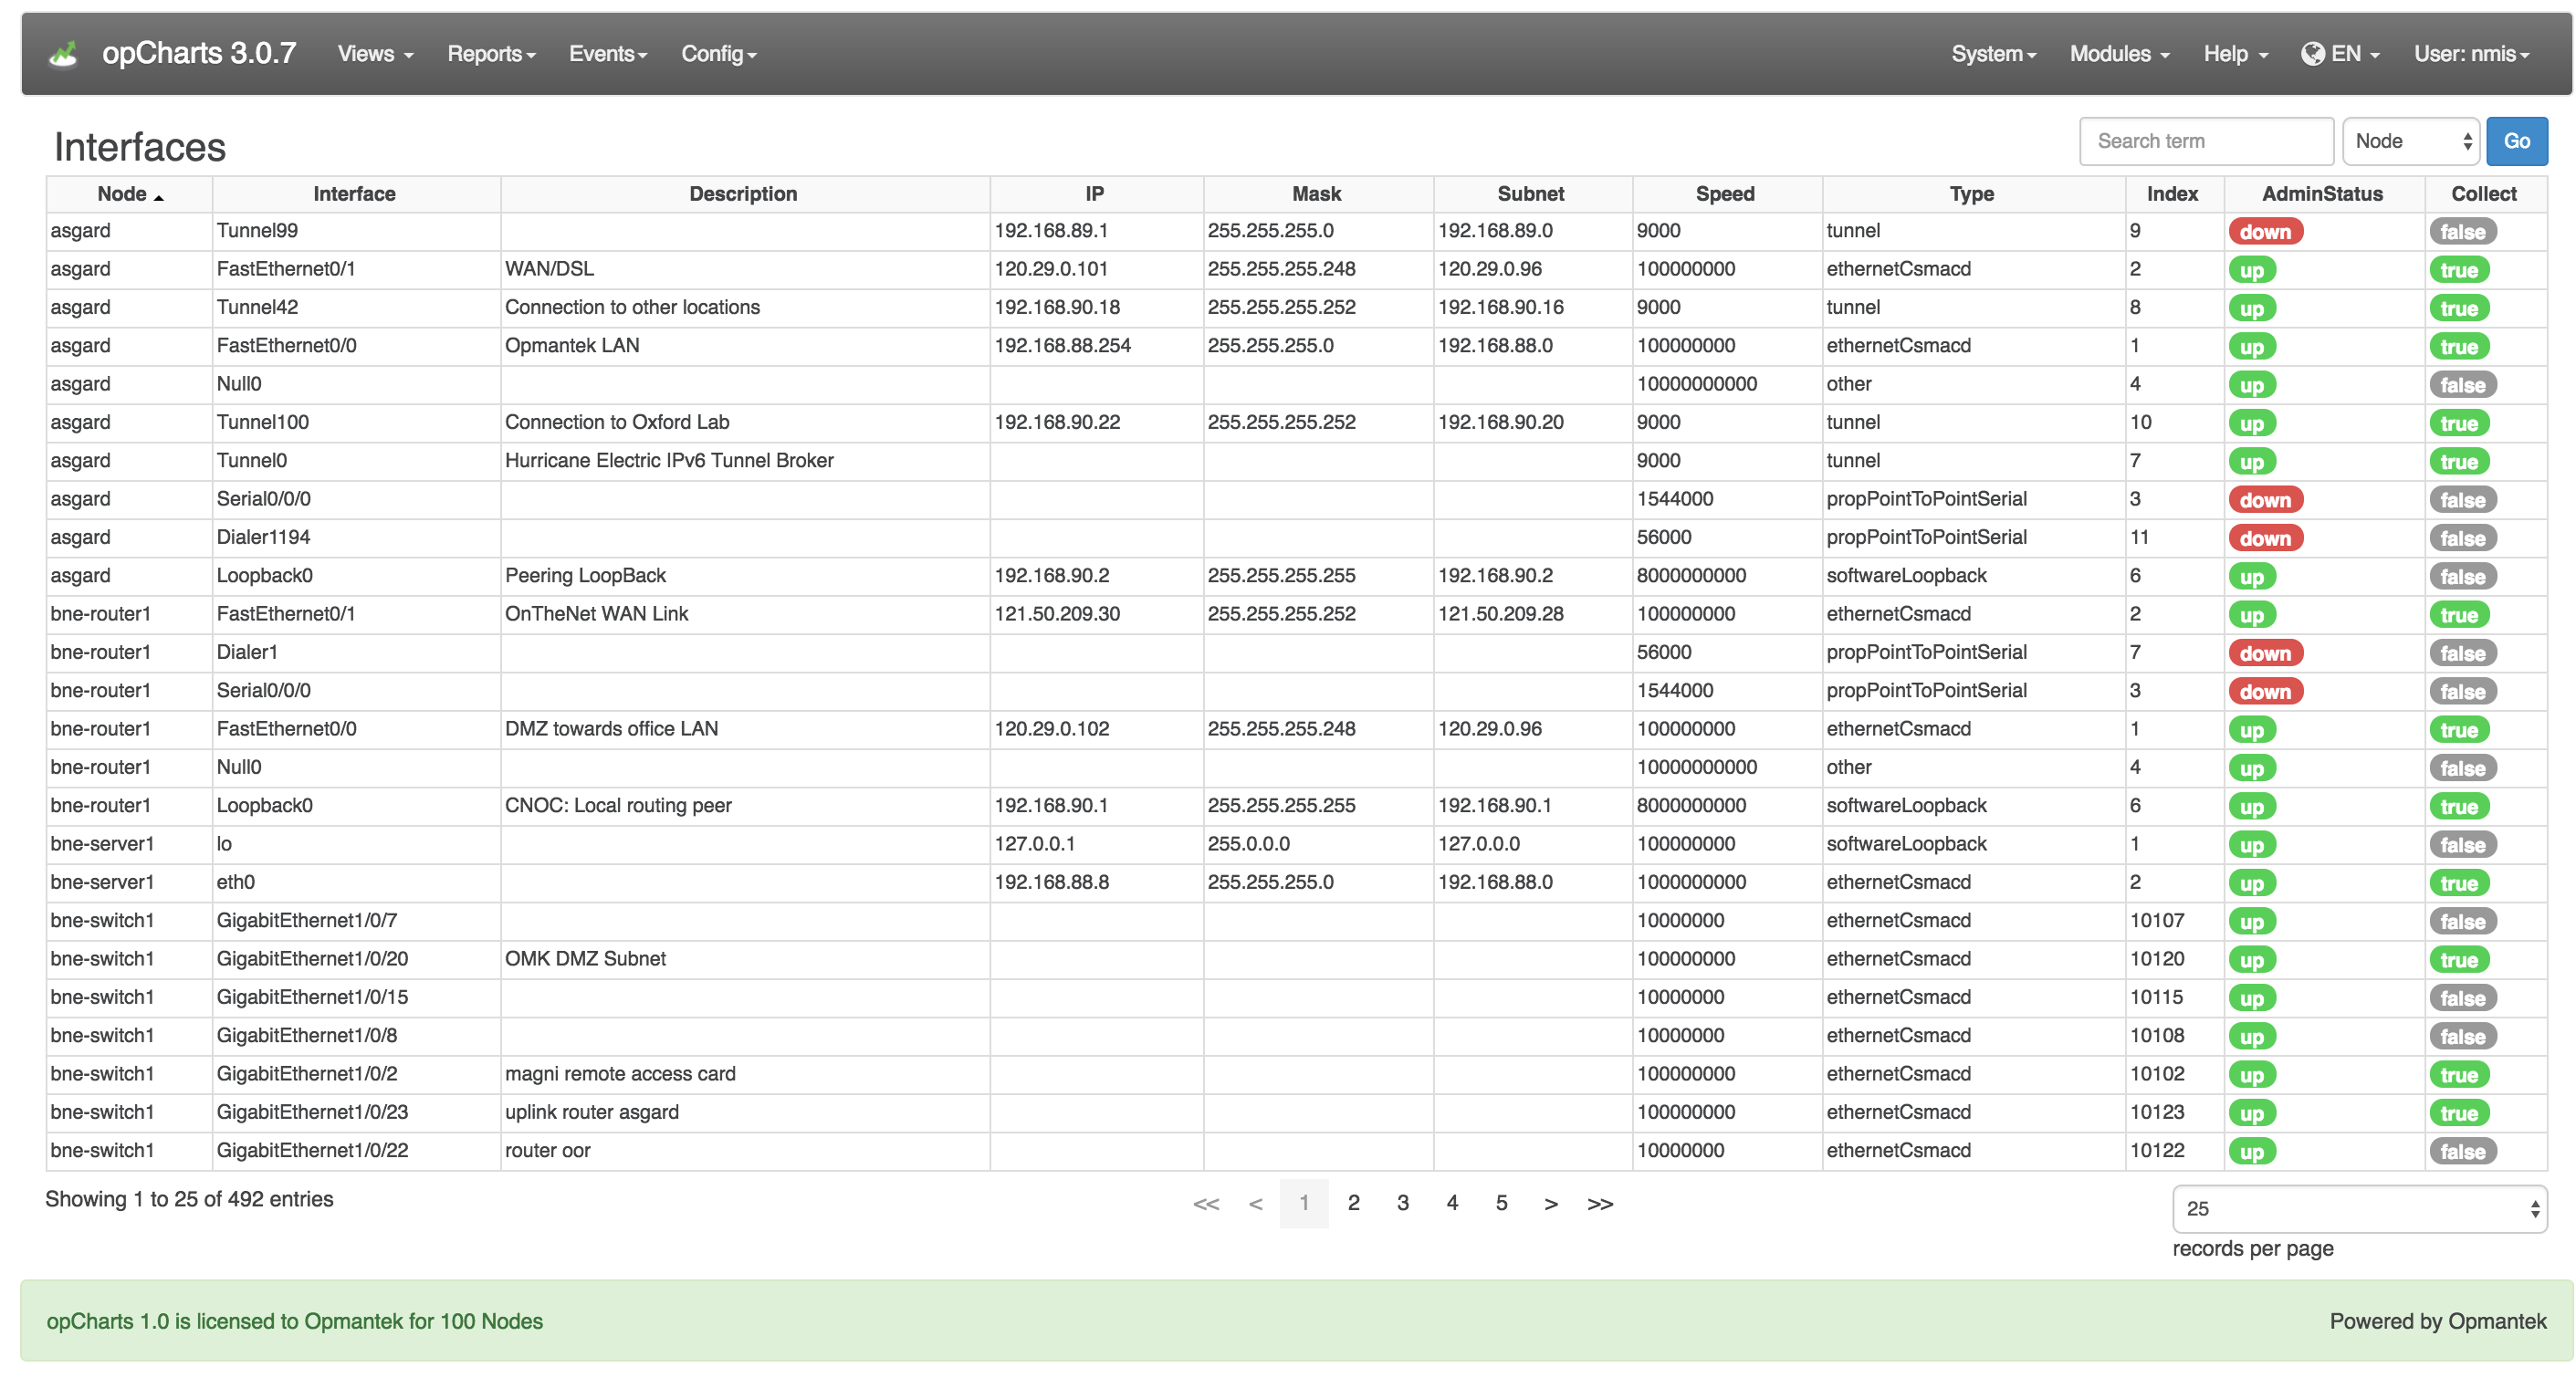
Interfaces View
This needs an explanation of what the interfaces view is.
Dashboard View
To open the Interfaces View, select Views -> Interfaces from the opCharts menu bar. This view provides an easy-to-search list of all interfaces in your environment. From here, the user can drill down into the details of individual nodes and interfaces.
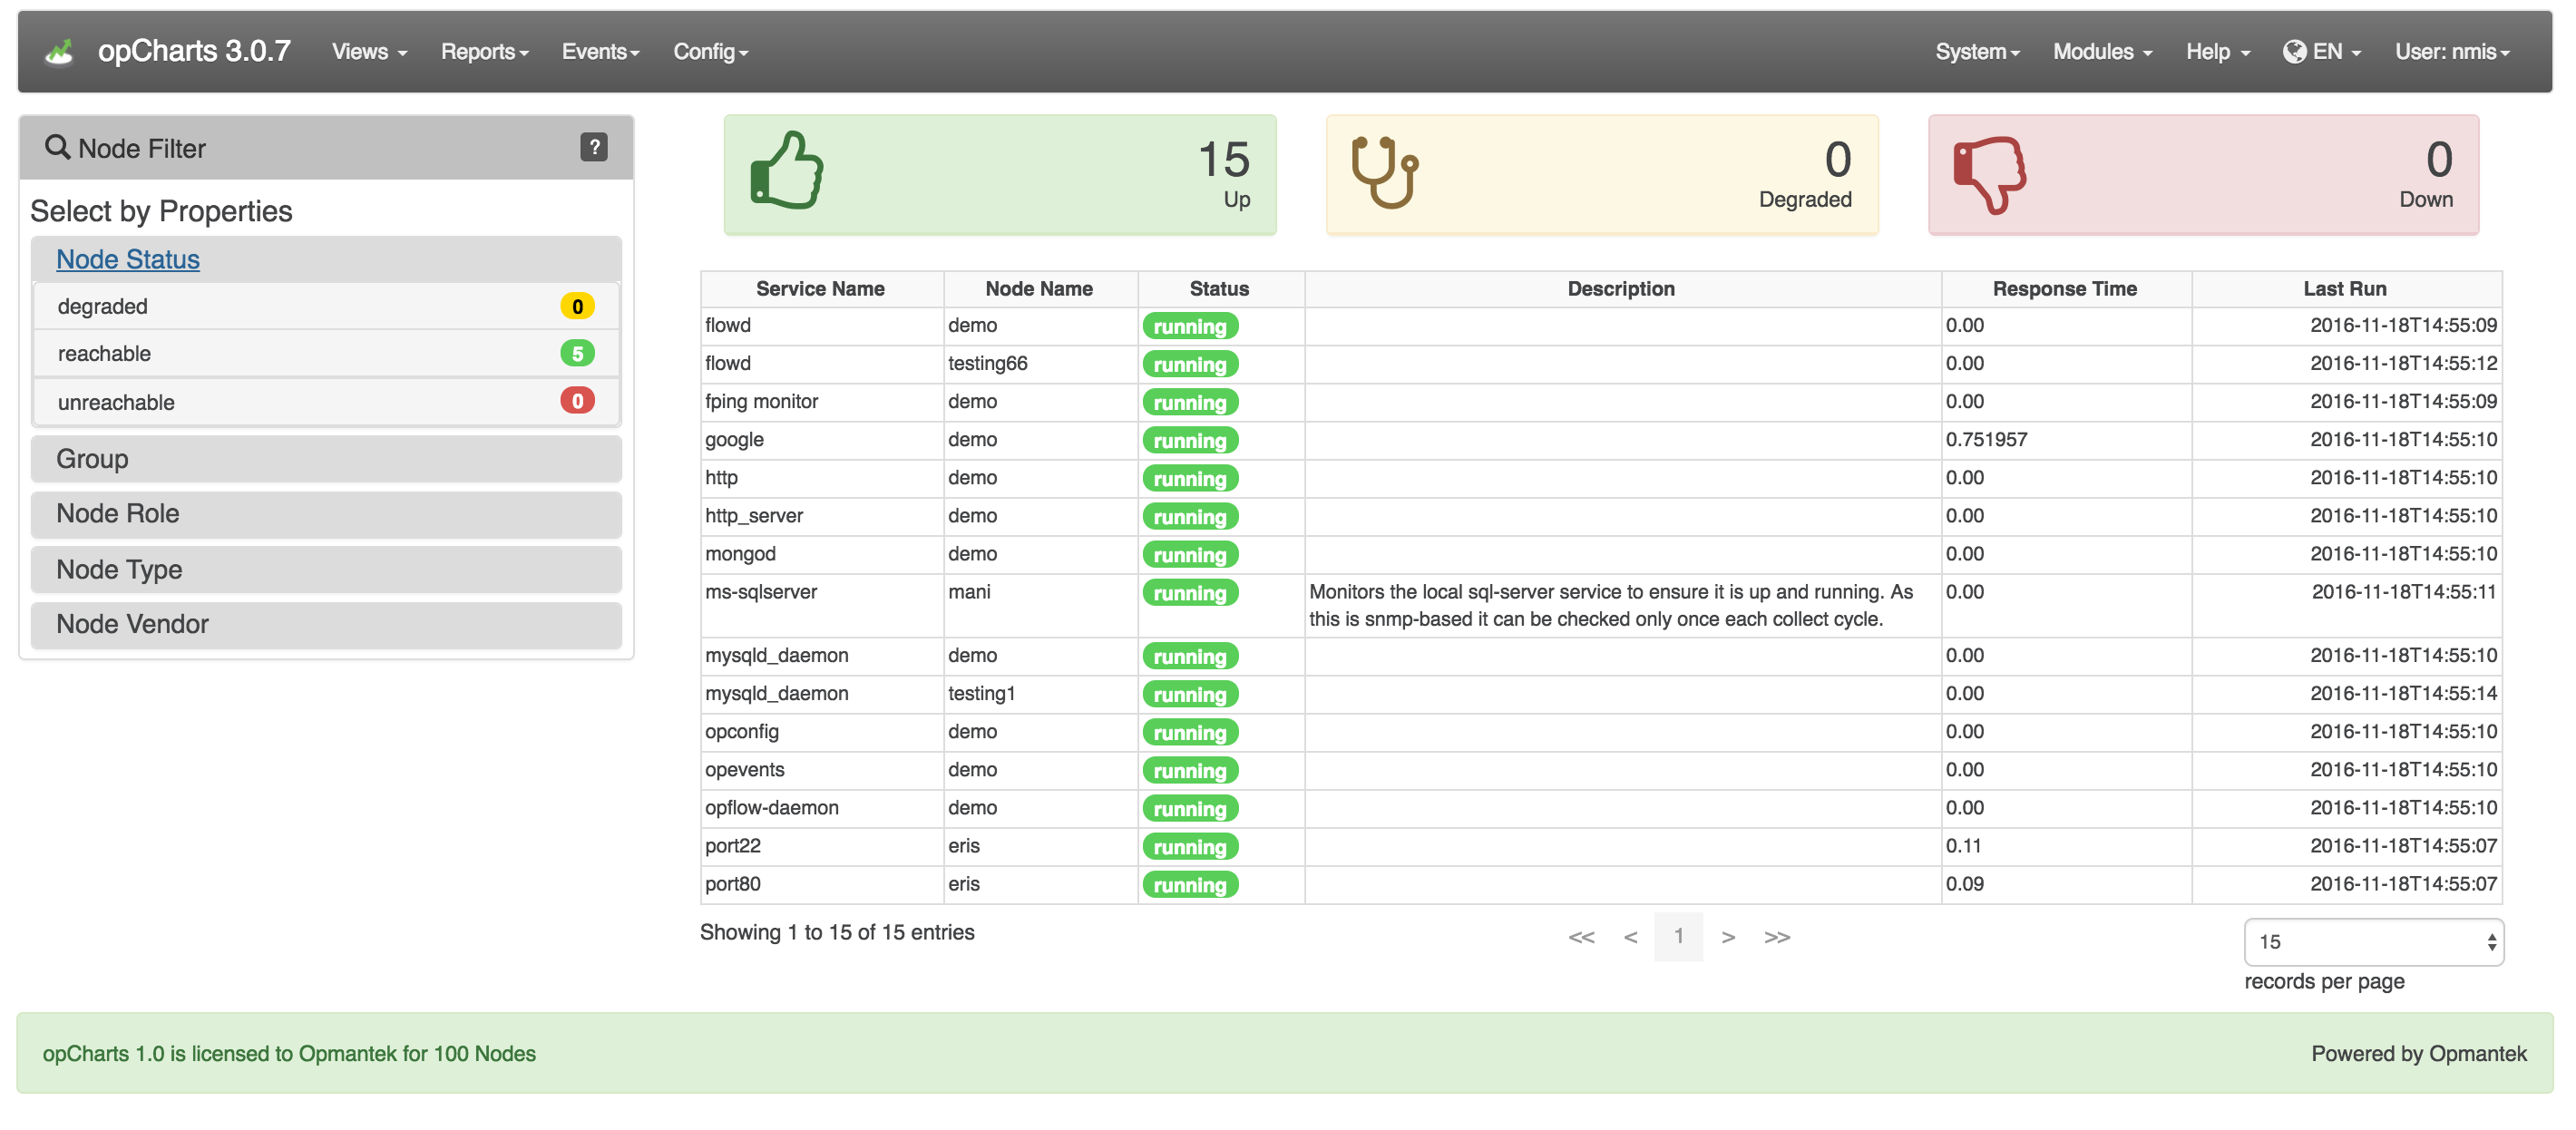
Monitored Services View
To open the Monitored Services View, select Views -> Monitored Services from the opCharts menu bar. Services can be filtered by groups such as node status and group.
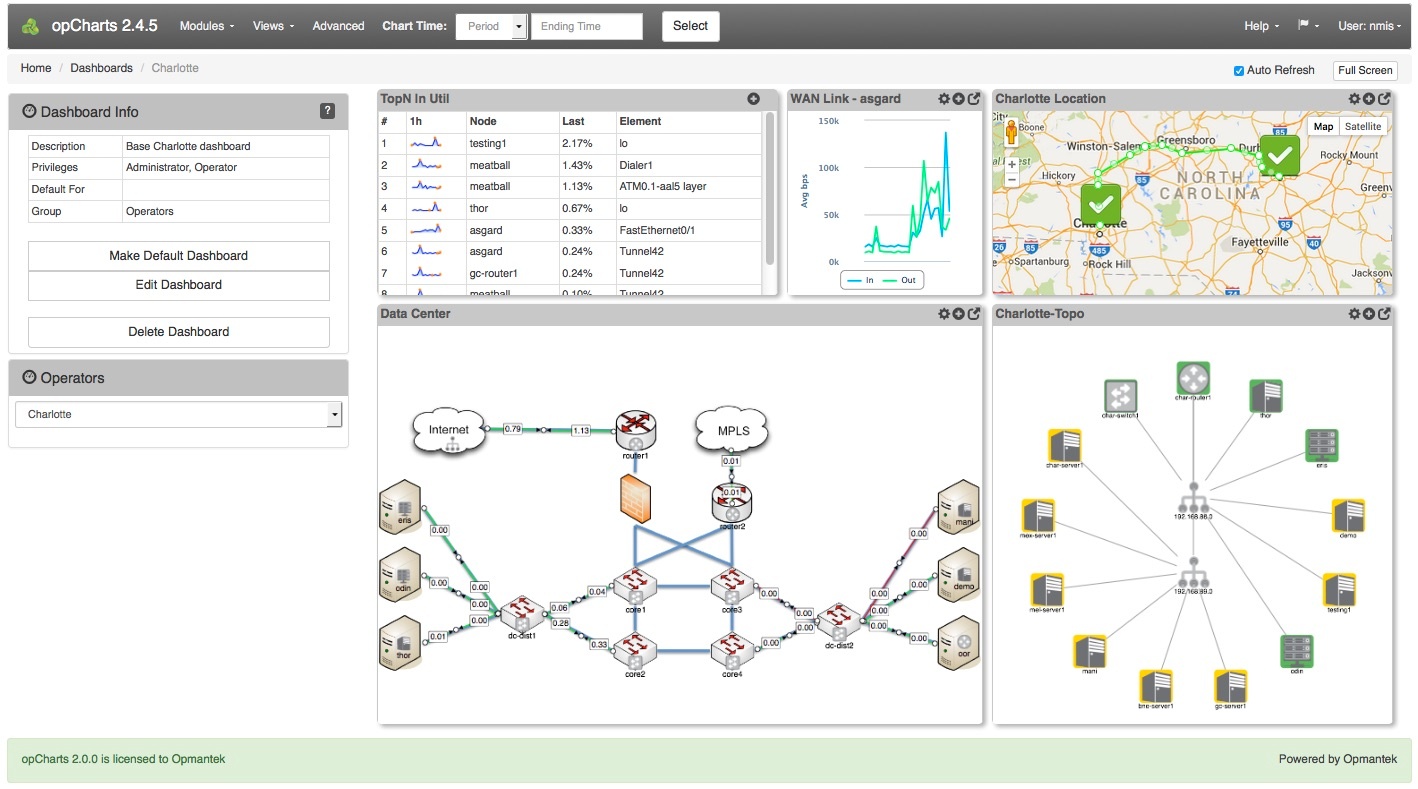
Dashboard View
To list all available Dashboards, select Views -> Dashboards The Dashboard Menu, listing all available Dashboards, can be opened by selecting View -> Dashboard from the opCharts menu bar. From there, the user can select to create a New Dashboard, and View/Edit/Delete an existing Dashboard.
TopN View
The open the TopN View can be opened by selecting , select Views -> TopN from the opCharts menu bar. The TopN view is actually a collection, or predefined dashboard, comprised of six opCharts Components. Any of these TopN charts can each be added to a new or existing Dashboard (see: Dashboards for more information) to create custom views.
...