...
Overview
opCharts supports three five primary views - : Nodes, Interfaces, Monitored Services, Dashboards, and TopN.
Nodes View
...
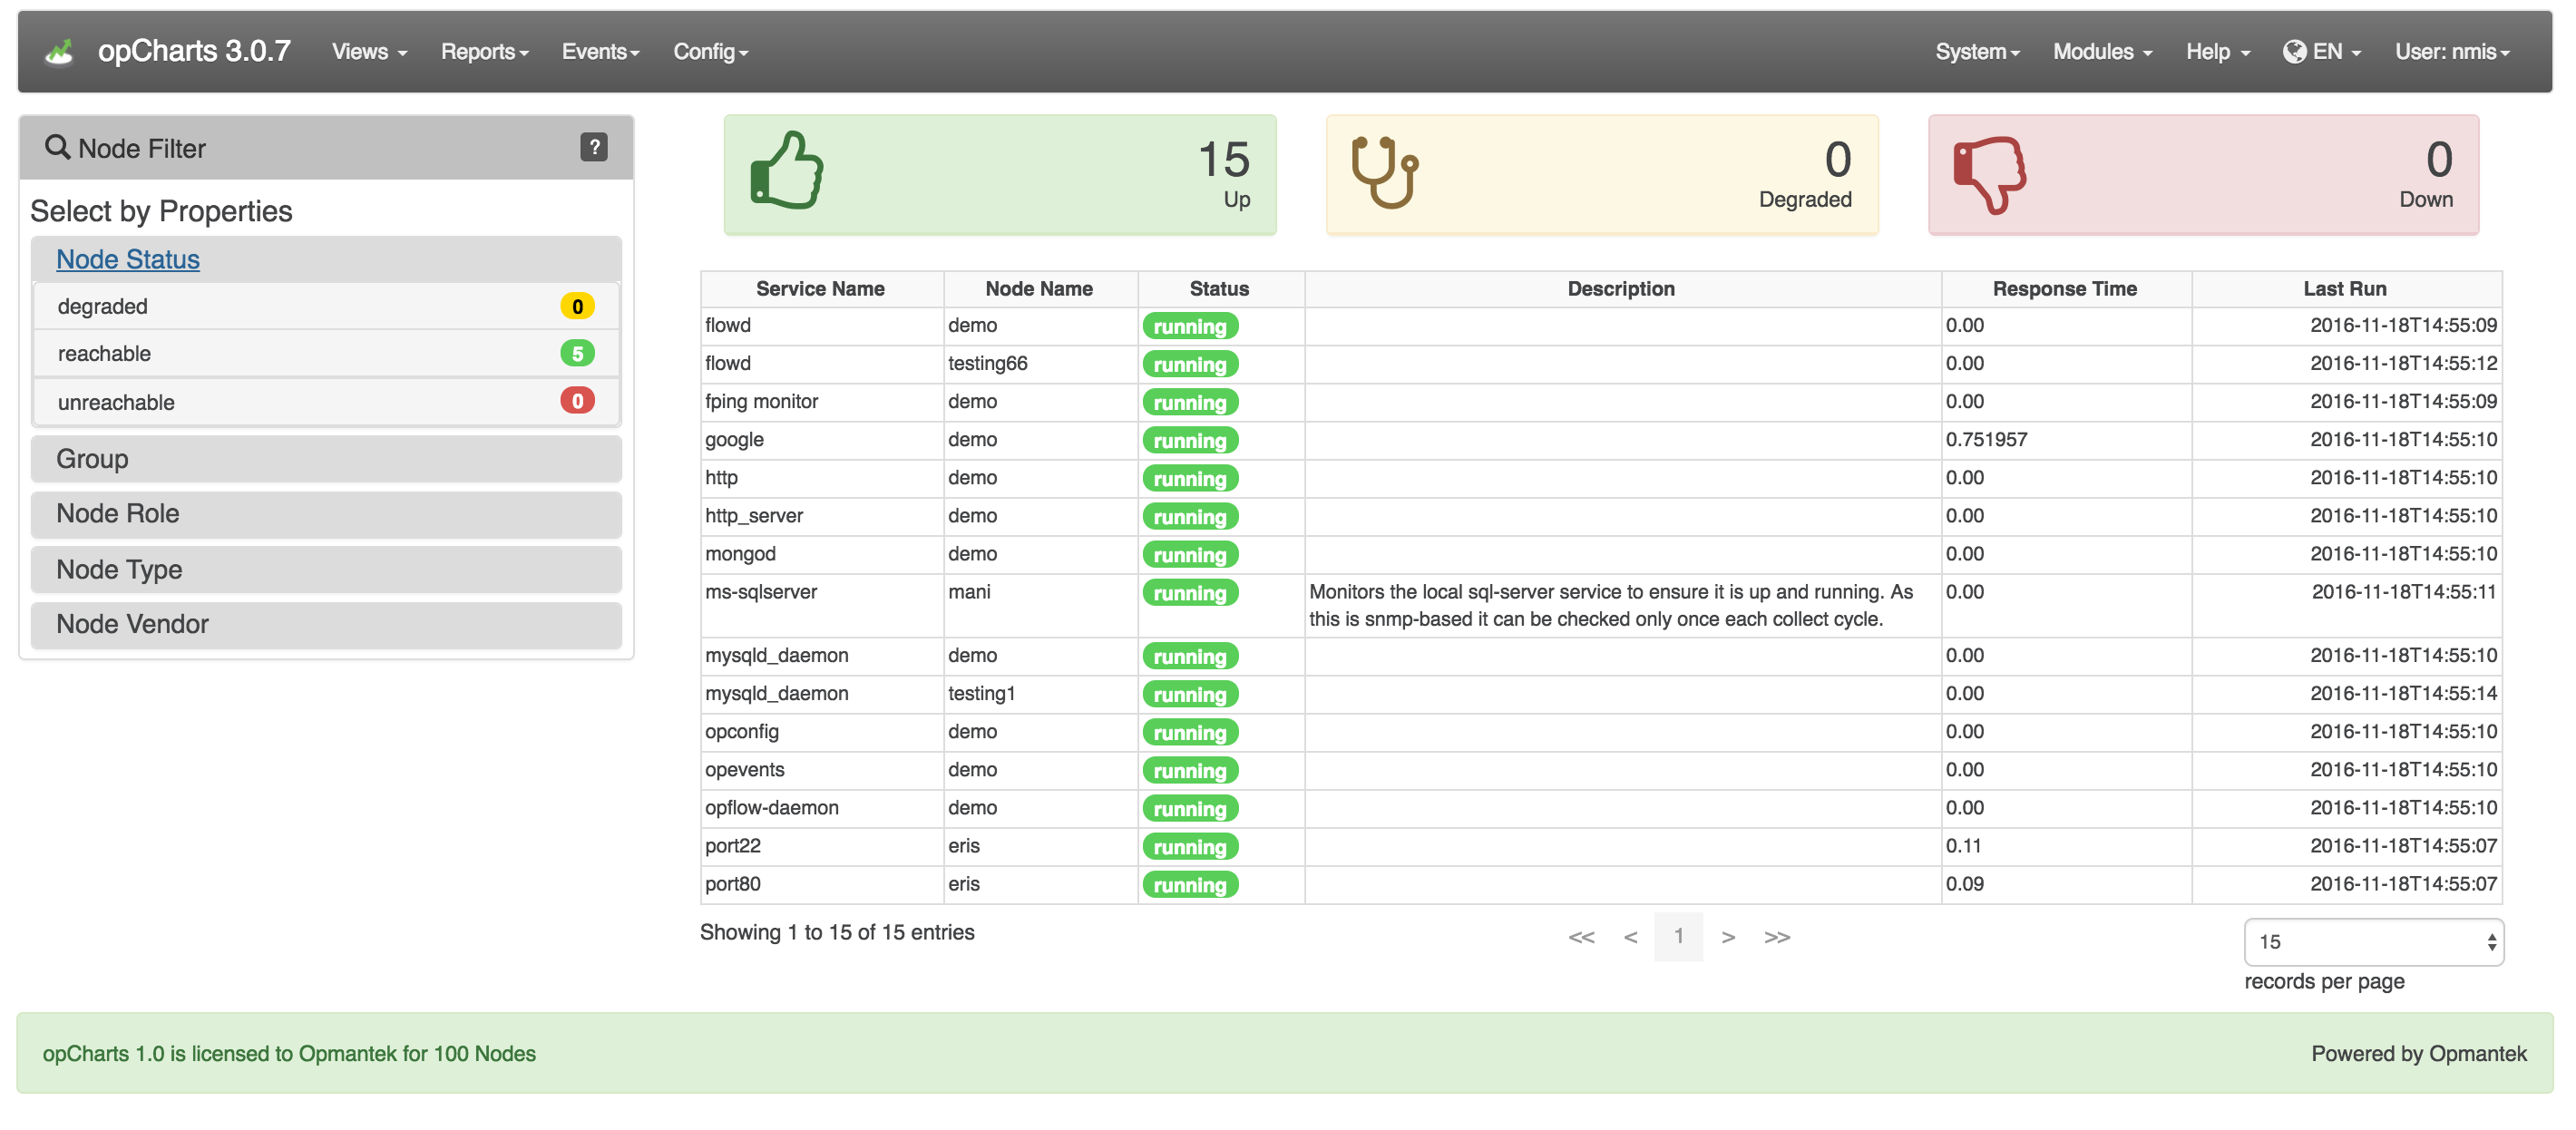
To open the Monitored Services View, select Views -> Monitored Services from the opCharts menu bar. Services can be filtered by groups such as node status and group.
...
Dashboards View
To list all available Dashboards, select Views -> Dashboards from the opCharts menu bar. From there, the user can select to create a New Dashboard, and View/Edit/Delete an existing Dashboard.
...