...
- See the current state of all systems from one place.
- See the history of all systems in one place.
- Provide operations teams with a single place to login and see what is happening.
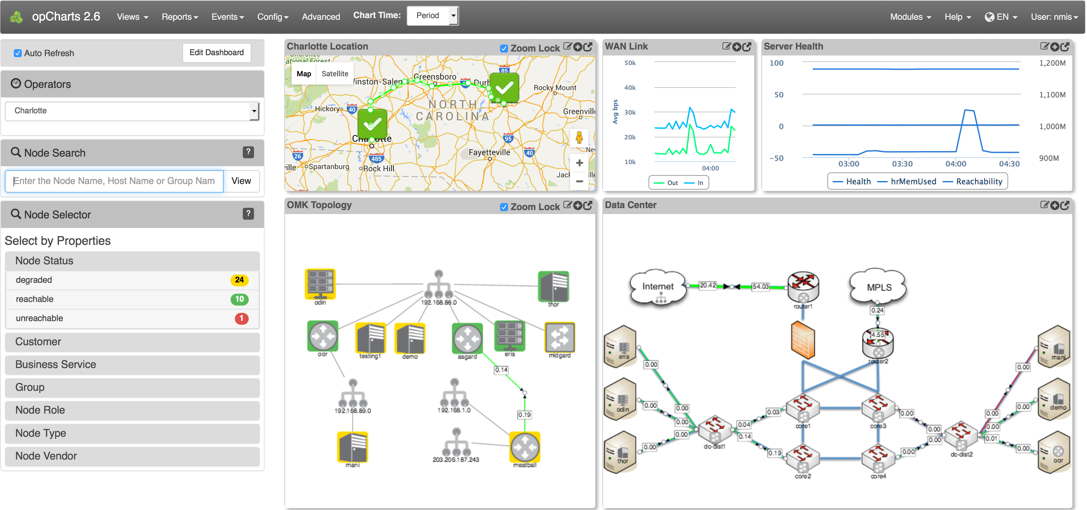
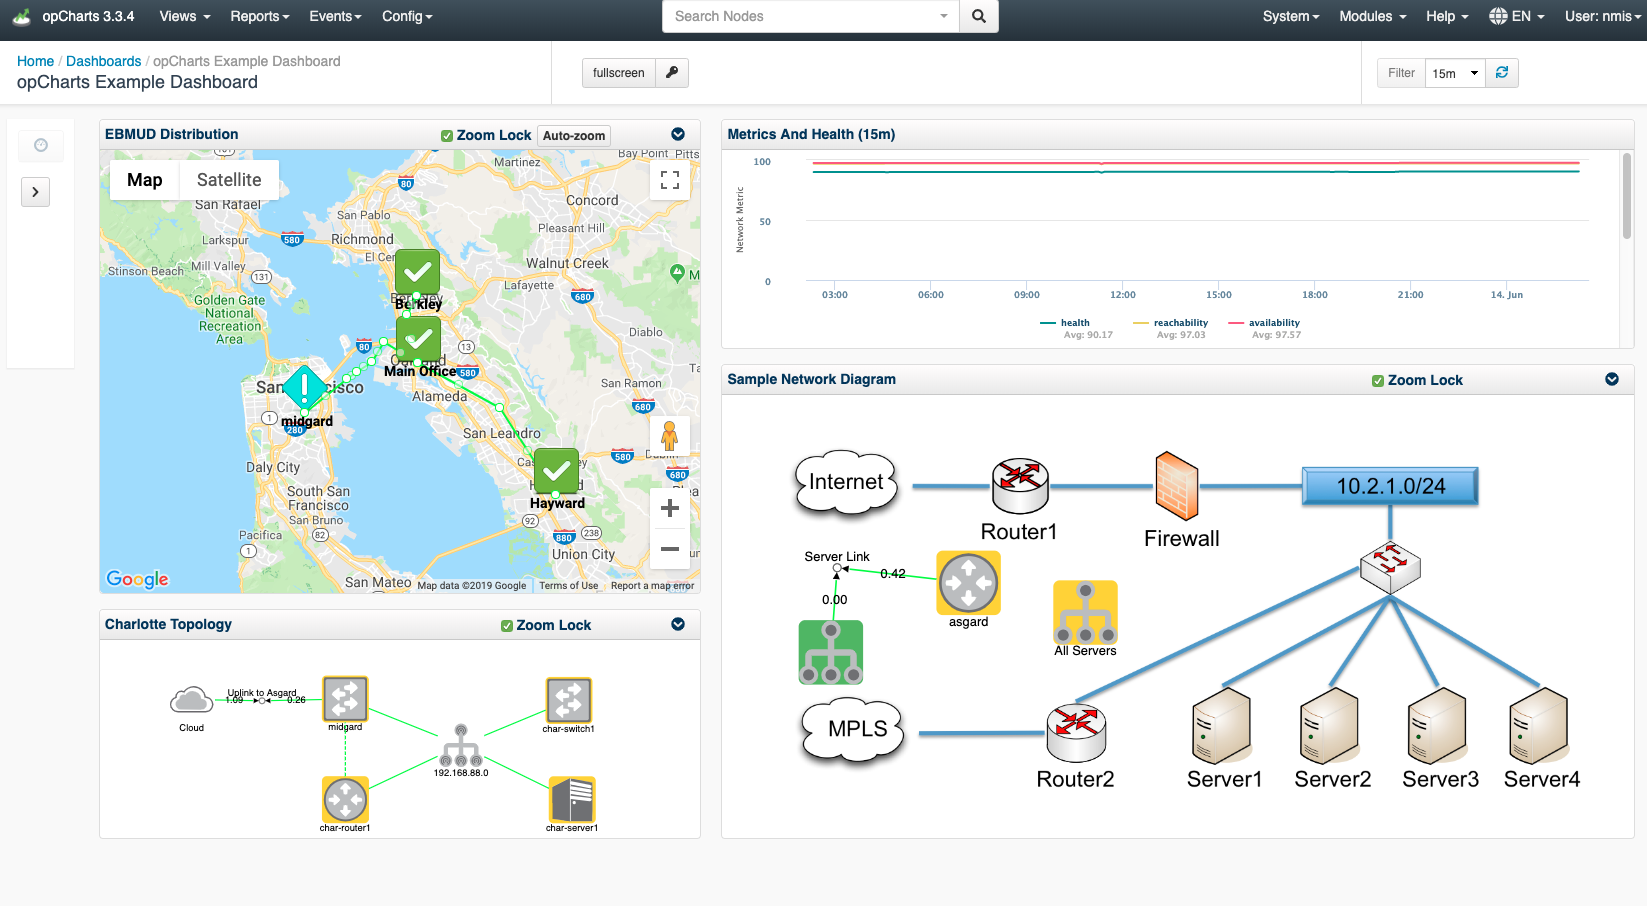
Example of a well-designed dashboard:
How to get a Single Pane of Glass using NMIS and opCharts
First, install NMIS there are two choices in going about doing this:
...
Opmantek Virtual Appliance Installation guide
Opmantek Virtual ApplianceMachine: Installation and Getting Started
After NMIS is installed you then need to Install/upgrade opCharts
Install/upgrade opCharts - opCharts Installation Guide
Get a free trial license key for opCharts - https://opmantek.com/opcharts-dashboards-charts-management/
...
The Add Component to Dashboard menu will open up, select the Dashboard Name from the drop down menu that you wish to add the Map to then click Save. Once you navigate back to your saved Dashboard this map will be displayed. You can follow this same process as adding Maps to your dashboard when adding any other desired data points.
2. The second way to accomplish designing your Single Pane of Glass Dashboard is by starting from the New Dashboard screen, click the Add Component button. This will open up a Component Info menu allowing you to adjust the Width and the Height of the component you wish to add to your dashboard. After selecting the size you want to display this information on the dashboard, click the Data Source Type drop-down menu to select the desired data for the Dashboard. Once the Data Source Type is selected, another drop-down menu will appear allowing you to choose the specific data point you want to display on the Dashboard. You can repeat this process to organize and add as many Components to your Dashboard as you want.
...