...
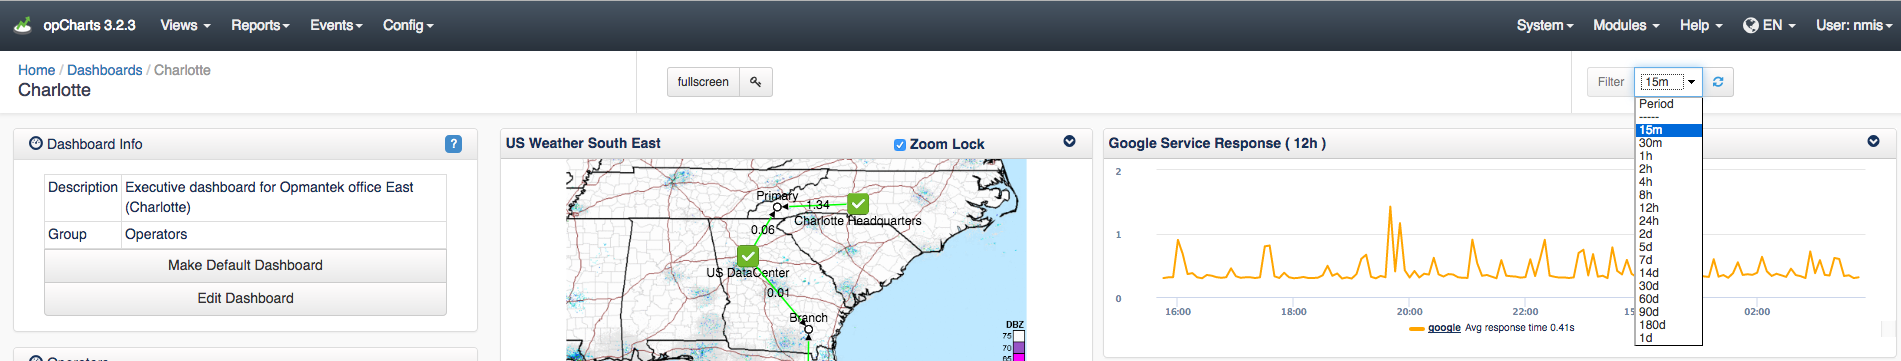
The opCharts menu bar includes a Filter field where you can select a time period to use in the current dashboard. This drop-down listbox is defined in opCommon.nmis under "opcharts_gui_period_values"
Adjusting node slector attributes
The opCharts Node Selector shows a list of attributes that can be selected to filter which nodes are shown in the nodes screen. If you are using custom attributes or want to be able to select nodes based on other attributes not shown such as Location or Business Service you can vary the slections selections by changing what is in "opcharts_node_selector_sections" in opComons.nmis. The same updates can be made to the Monitored Services Selector filters with the attributes in "opcharts_monitored_service_selector_sections"
...
The width value should be adjusted to fit your needs.